
If you just started spending some time around trading content you’ve probably come across terms like
- FVG
- iFVG
- LQS
- CISD
- DOL
and more.
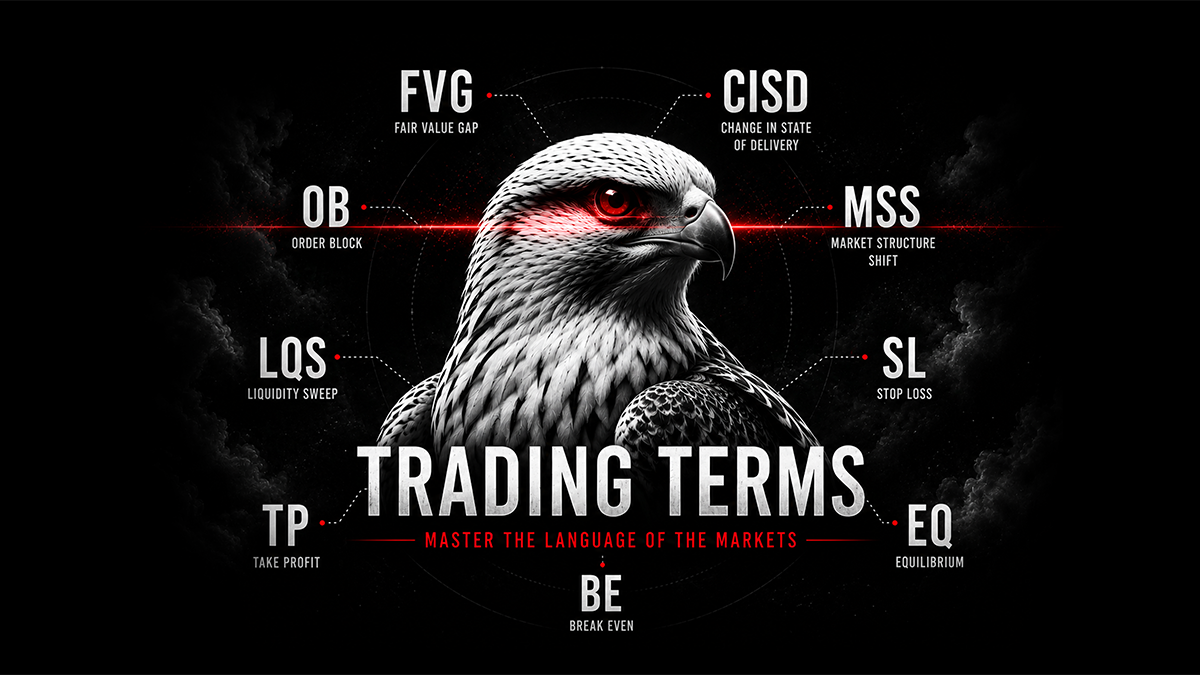
This article is a reference guide that explains common trading terms in simple, straight forward language.
Trading Terms explained
Concepts that can be used for entries should only be used in combination with context. Always look at overall market structure, define your bias and determine the draw on liquidity.
SL: stop loss
A stop loss is an order that automatically closes your position if the market moves against you and reaches a predetermined price.
It is used to manage risk by limiting losses.
Example: You buy one MNQ contract at 29.000 and put your stop loss at 28.959. Your position will automatically close when price drops down to that level to prevent further losses.
When trading futures, you can (usually) also use buy/sell stops instead of the standard stop loss order. Just make sure it matches the contract size of your position.
In fast moving markets, overnight hours, or when trading large size, a stop loss may be filled at a different price than expected due to slippage. The difference is usually small though, so no need to be scared.
TP: take profit
A take profit is an order that automatically closes your position at a predetermined profit target.
Traders use this to fully or partially realize profits without having to manually close the trade.
Example: You buy 1 MNQ contract at 22.000 and put your take profit at 22.080.
If price goes up and hits that level, your position automatically closes and your profit is realized.
Just like with a Stop loss order (and with entries) slippage can occur.
BE: breakeven
Many traders move their stops to the entry point as part of their risk management after price moved in their favor to a certain point.
If the market reverses and hits your stop loss at breakeven, the trade will close at or near your entry price resulting in no profit and no loss (excluding commissions and potential slippage).
LTF
Lower timeframe
HTF
Higher timeframe
DOL: draw on liquidity
DOL is the price level where the market is likely moving toward to take liquidity.
The draw on liquidity is used as a profit target.
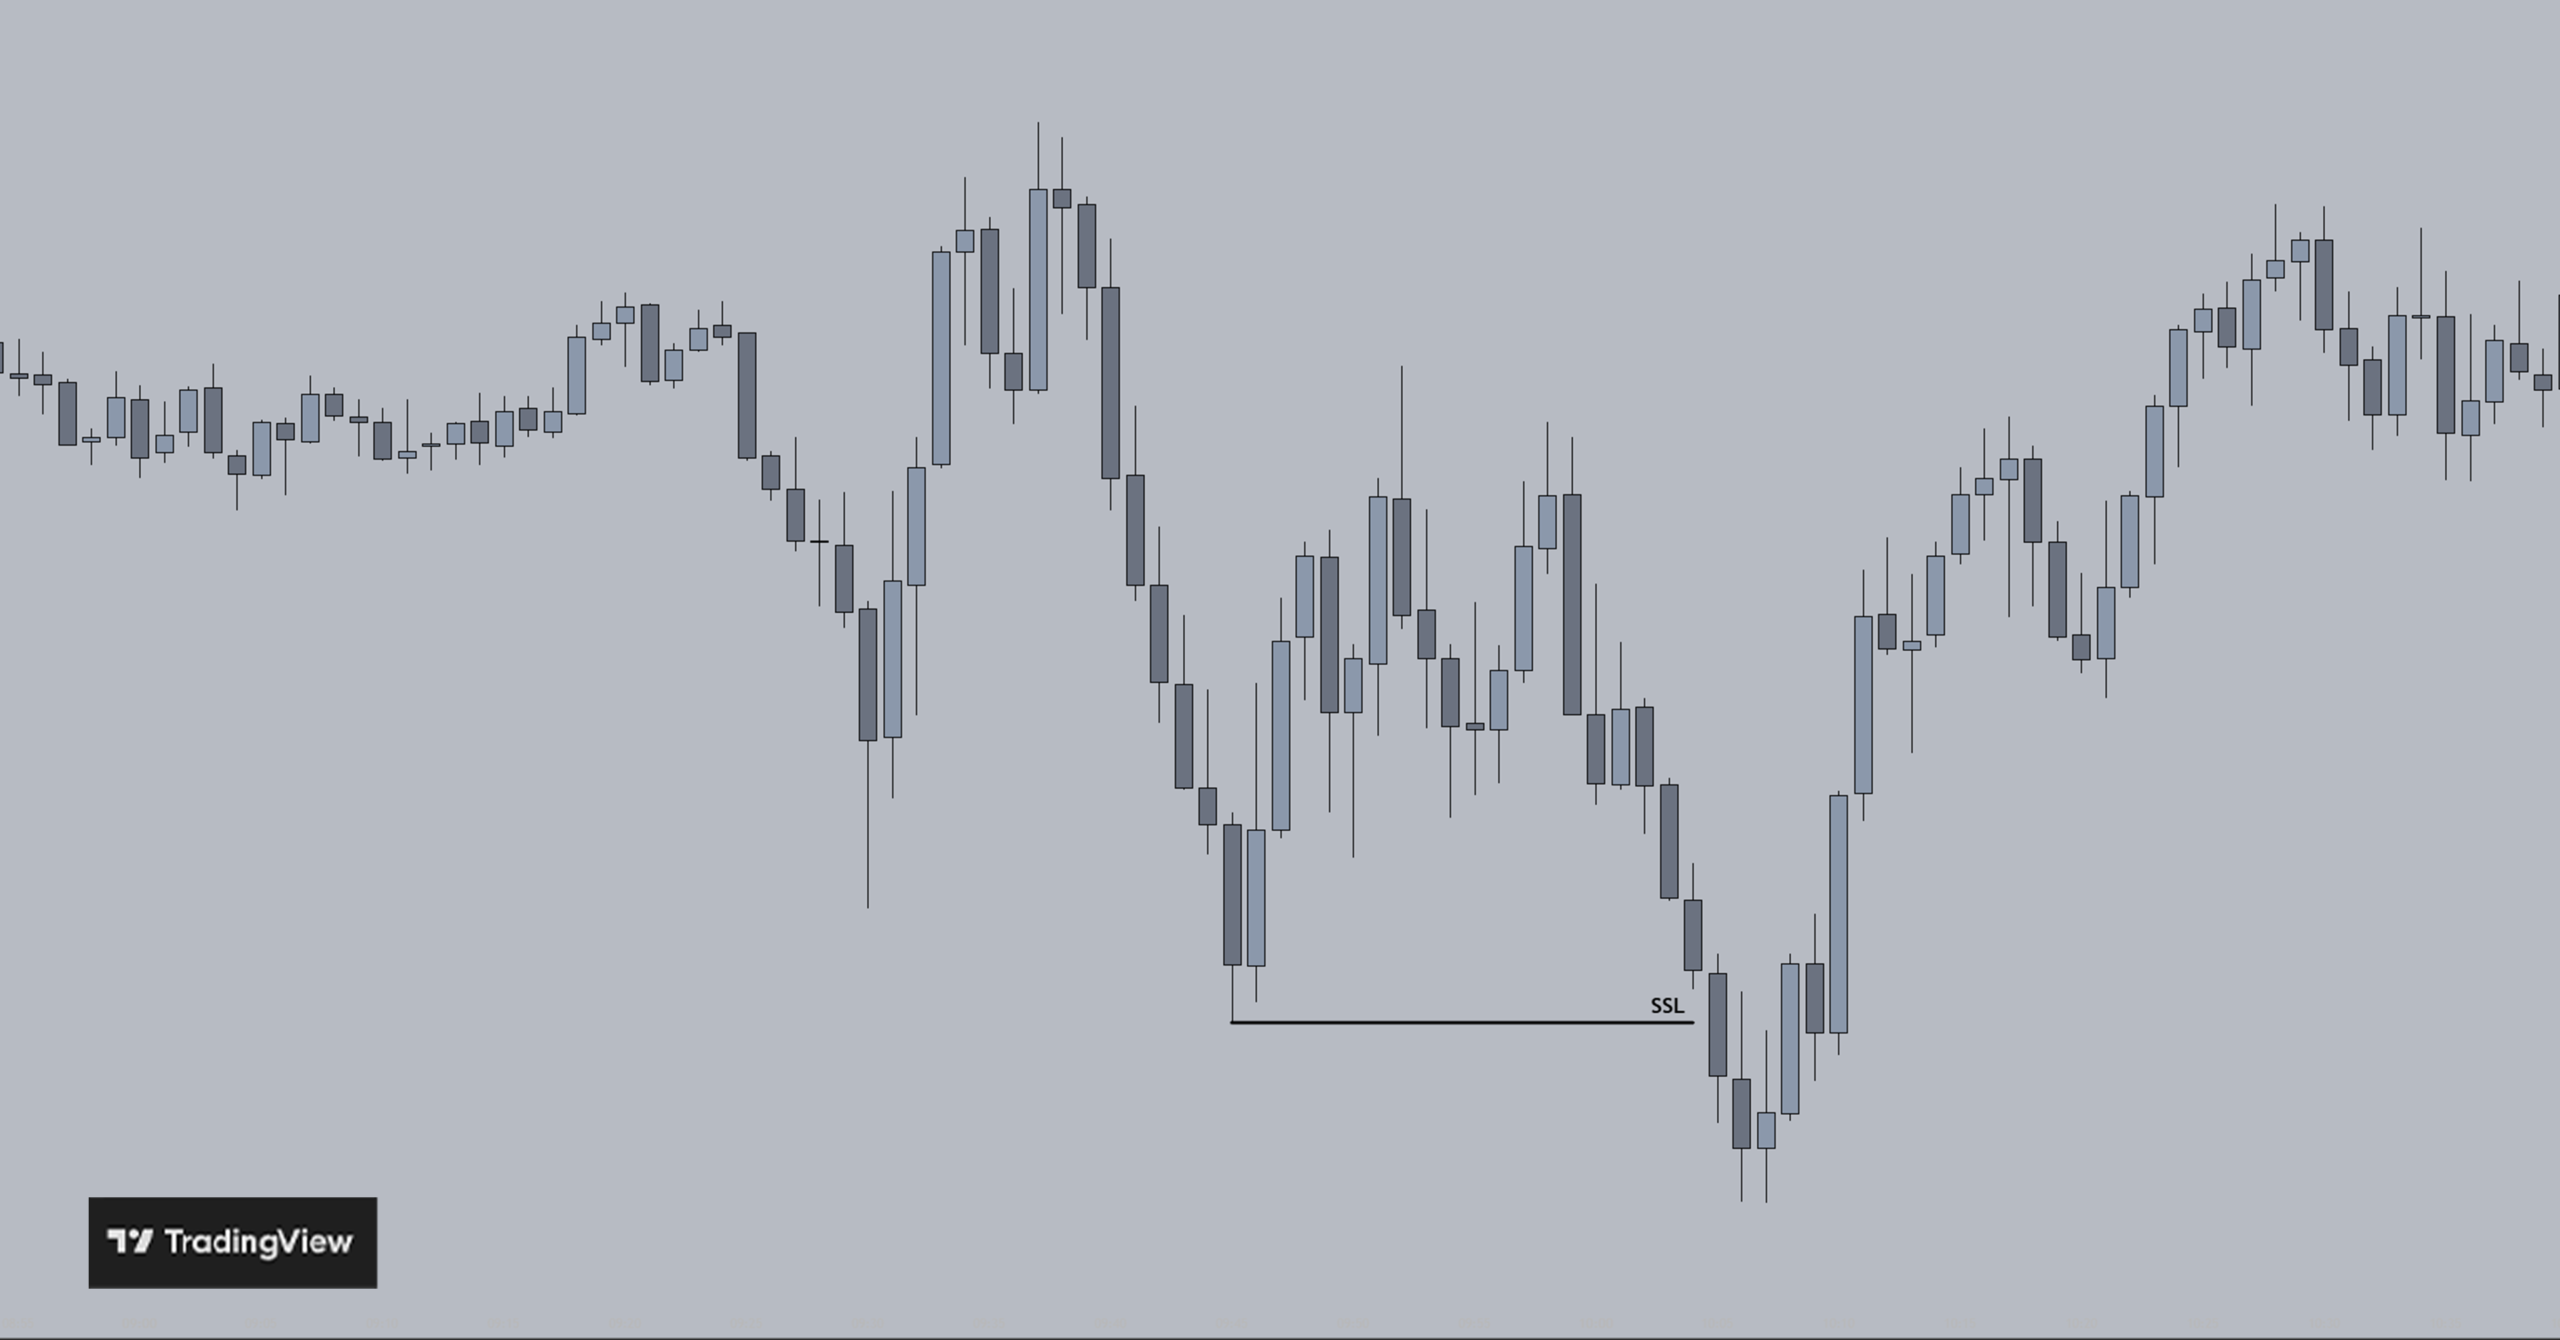
SSL: sell side liquidity
Sell side liquidity is resting at swing lows. Many retail traders place their stop losses for long position at these levels. Price will oftentimes come back to this level to sweep liquidity and then continue it‘s direction.
Sell side liquidity can be used as a profit target and as a point of interest where a potential long setup might form after liquidity is taken.
charts by TradingView
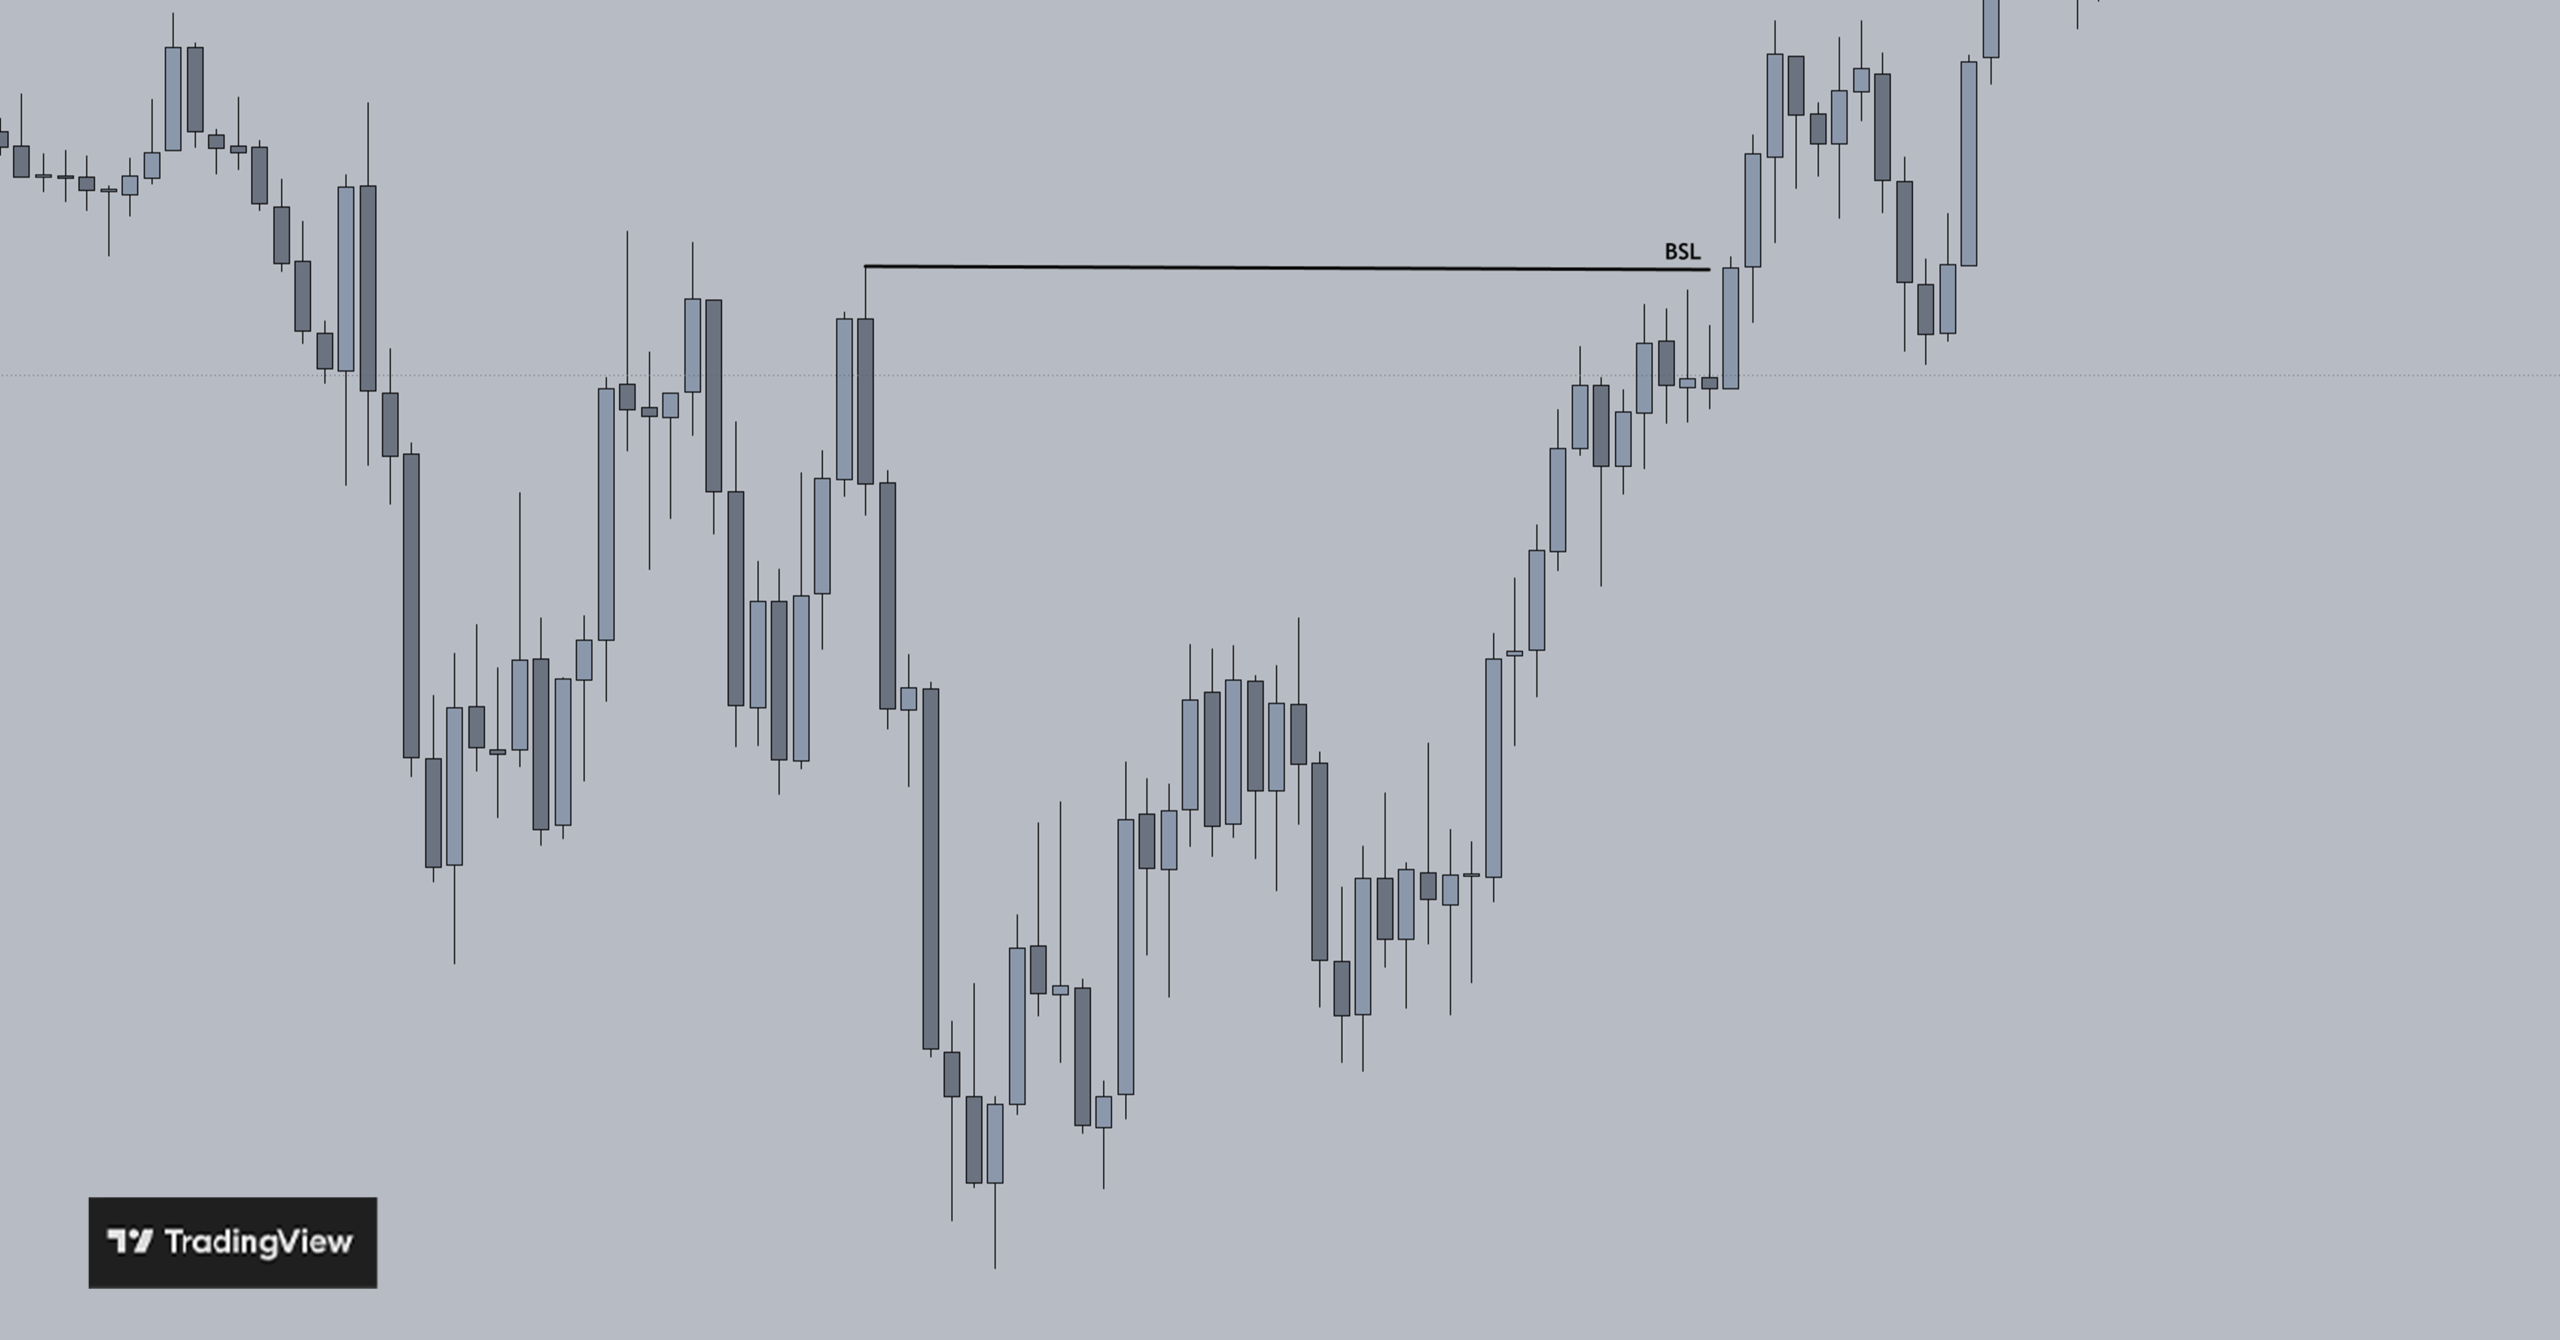
BSL: buy side liquidity
Buy side liquidity is resting at swing highs. Many retail traders place their stop losses for short position at these levels. Price will oftentimes come back to this level to sweep liquidity and then continue it‘s direction.
Buy side liquidity can be used as a profit target and as a point of interest where a potential short setup might form after liquidity is taken.
charts by TradingView
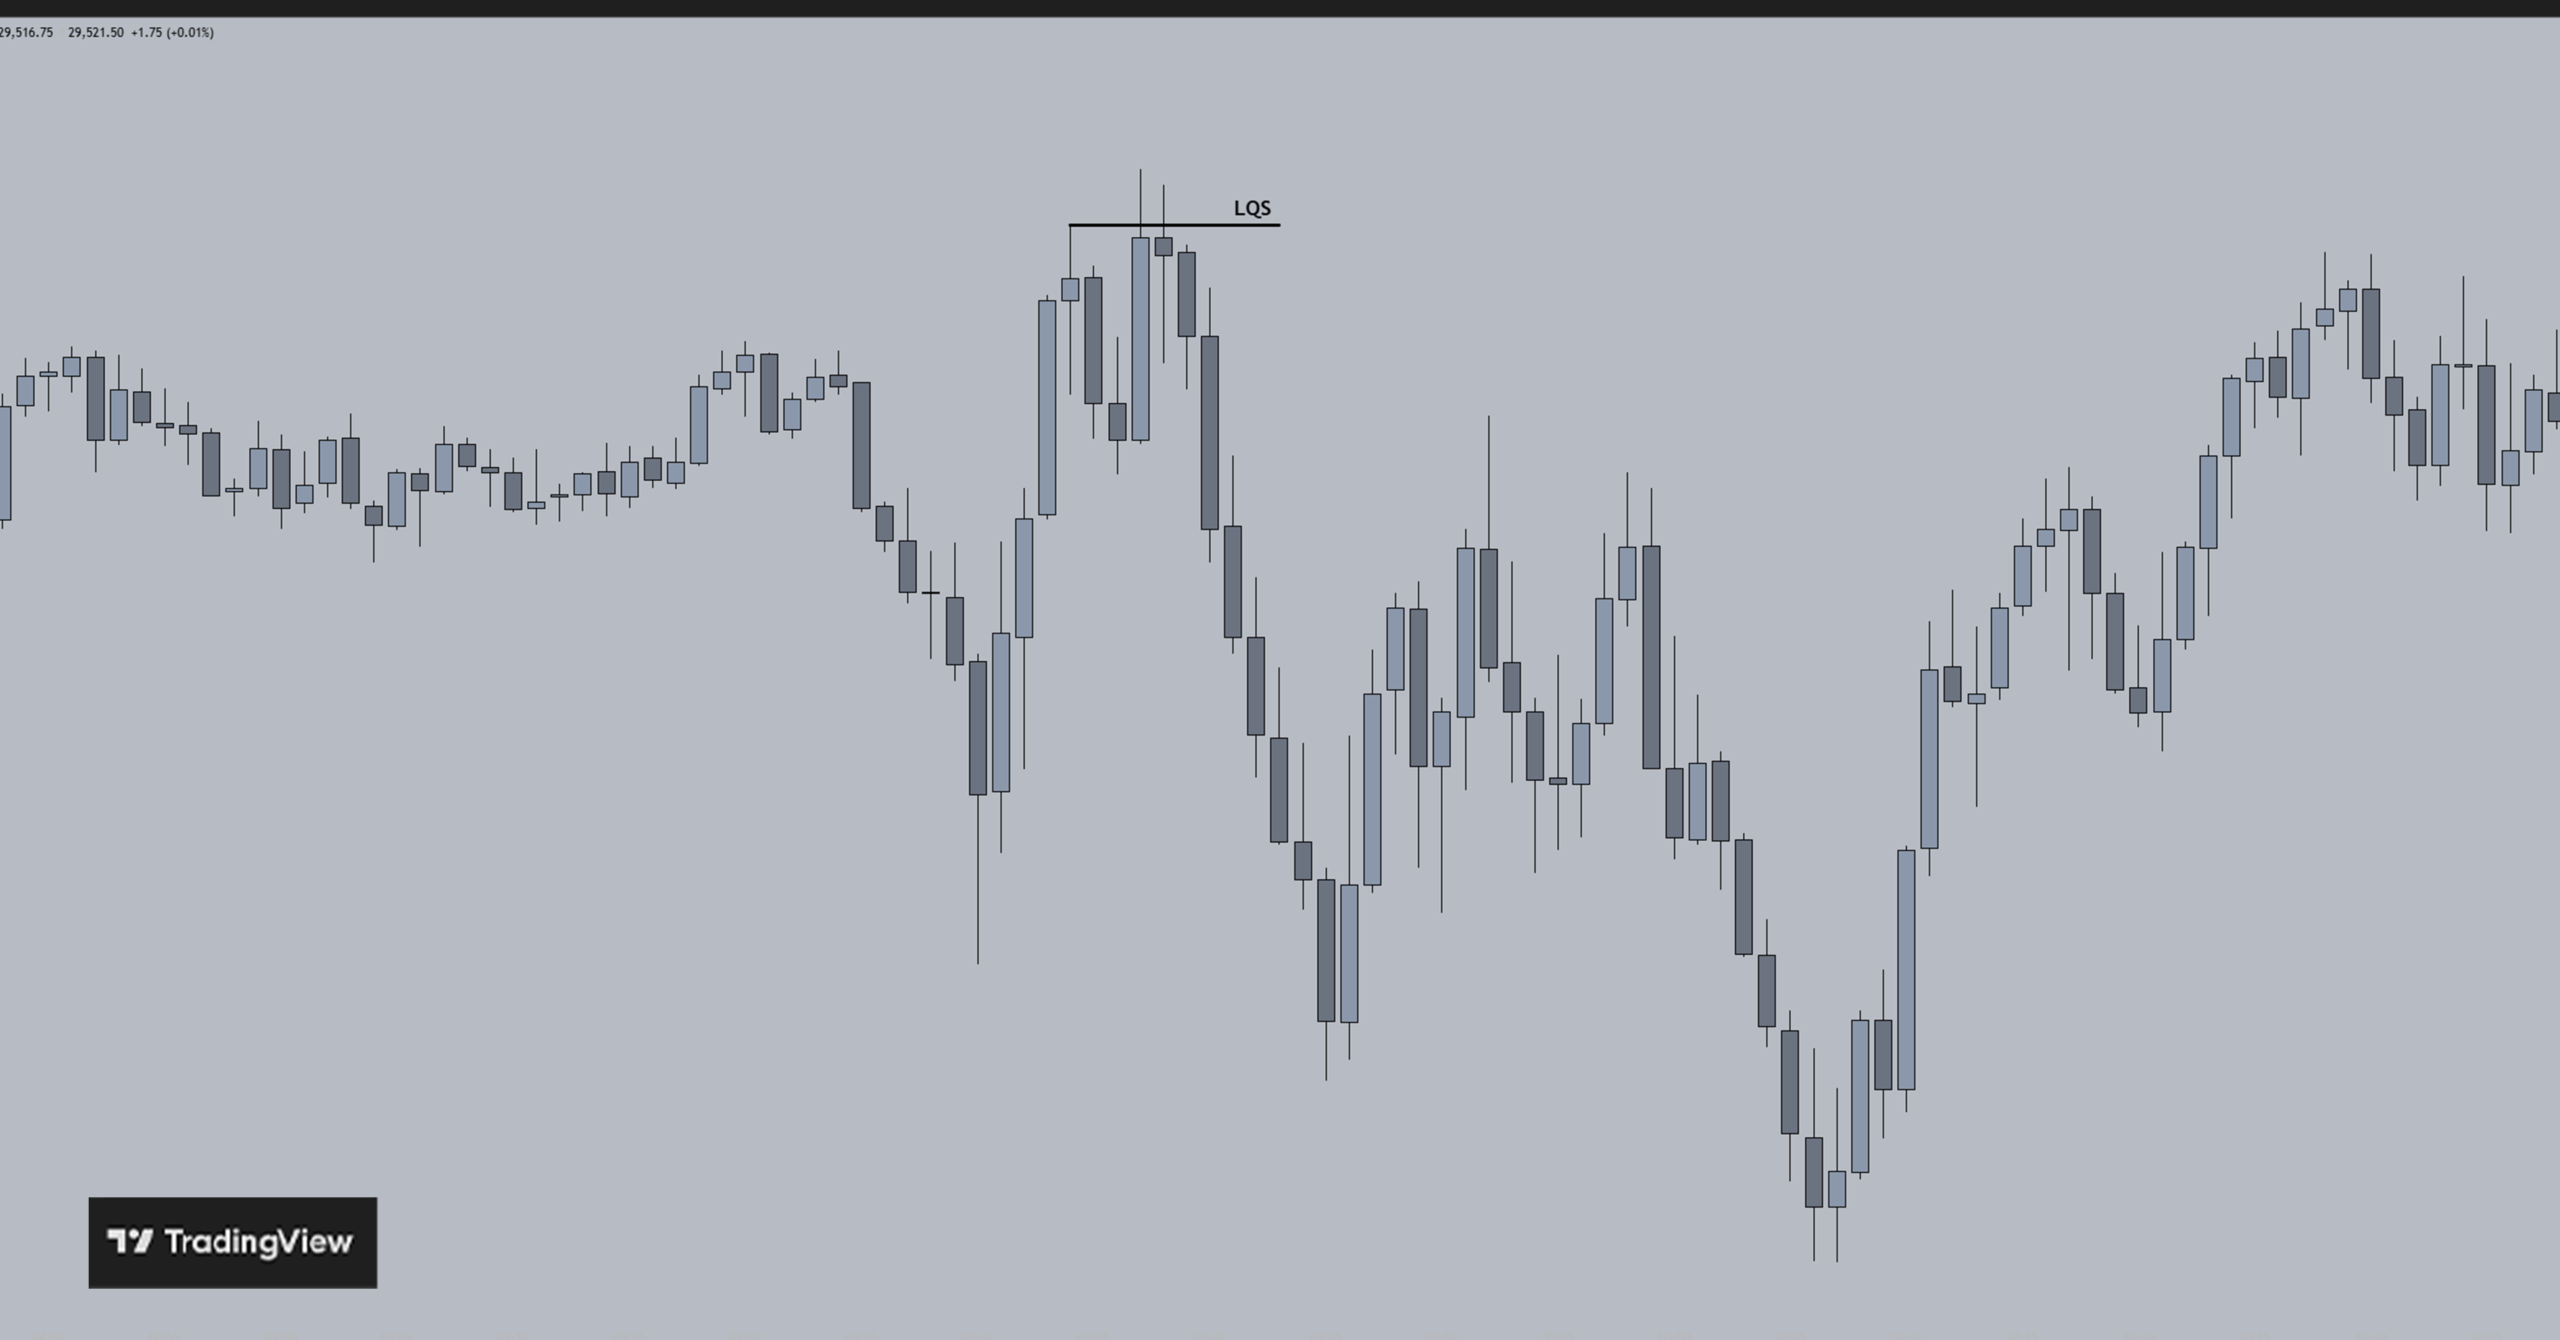
LQS/lq-sweep: Liquidity sweep
Liquidity is often found above swing highs and below swing lows because many traders place their stops at these levels.
A liquidity sweep occurs when price briefly moves above a previous high or below a previous low to grab liquidity by triggering stop losses and pending orders before reversing direction.
Liquidity sweeps can be combined with other concepts like FVGs and CISDs to create an entry model.
charts by TradingView
FVG: Fair value gap
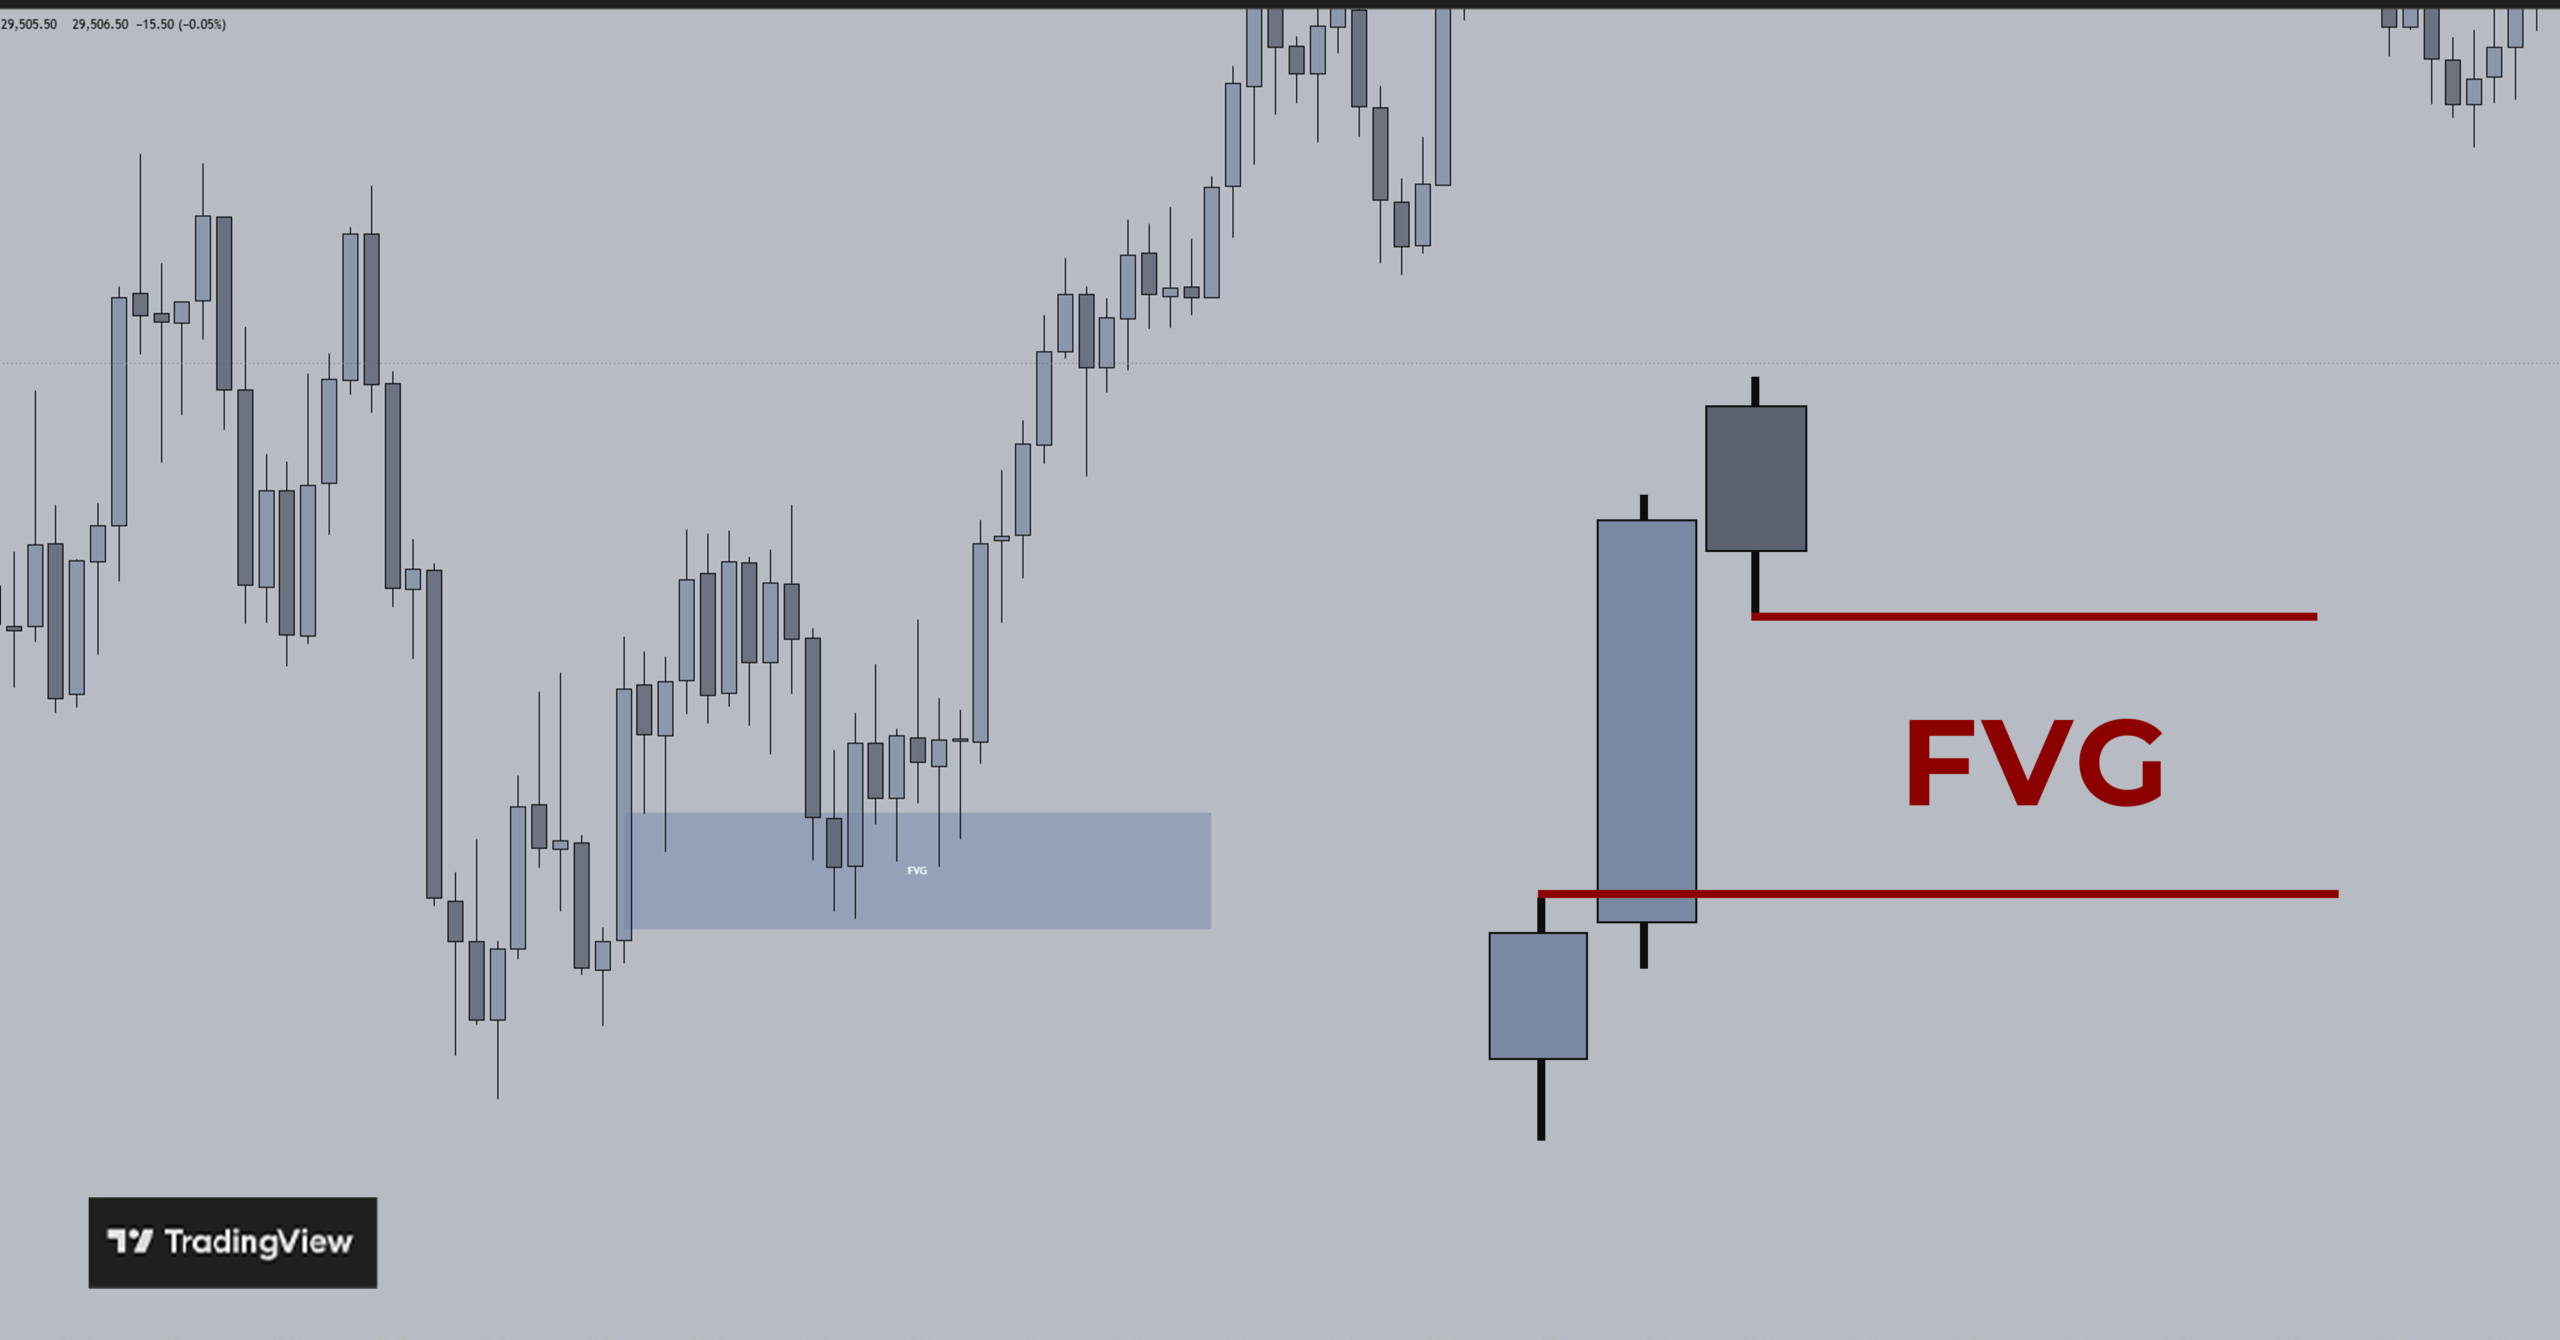
A fair value gap is a three candlestick pattern representing an imbalance in price action. A fair value gap usually includes a strong displacement candle (big impulse candle) in the middle, creating a gap between the previous and the following candle.
Strong displacement creates more meaningful FVGs.
You could think of it as price moving so aggressively that it skips over prices and leaves inefficient delivery behind. Meaning there is an imbalance in price.
This imbalance acts like a magnet, price usually gets back to that level to rebalance price (fill the FVG) and then continuing the move.
A bullish FVG is created by an upward move and a bearish FVG is created by a downward move.
Fair value gaps can be combined with other concepts like a liquidity sweep to create an entry model, to find a bias and to figure out the draw on liquidity.
charts by TradingView
iFVG: inversion fair value gap
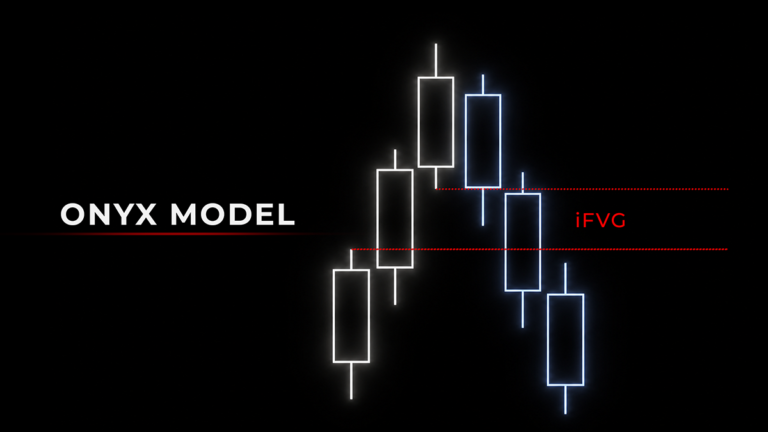
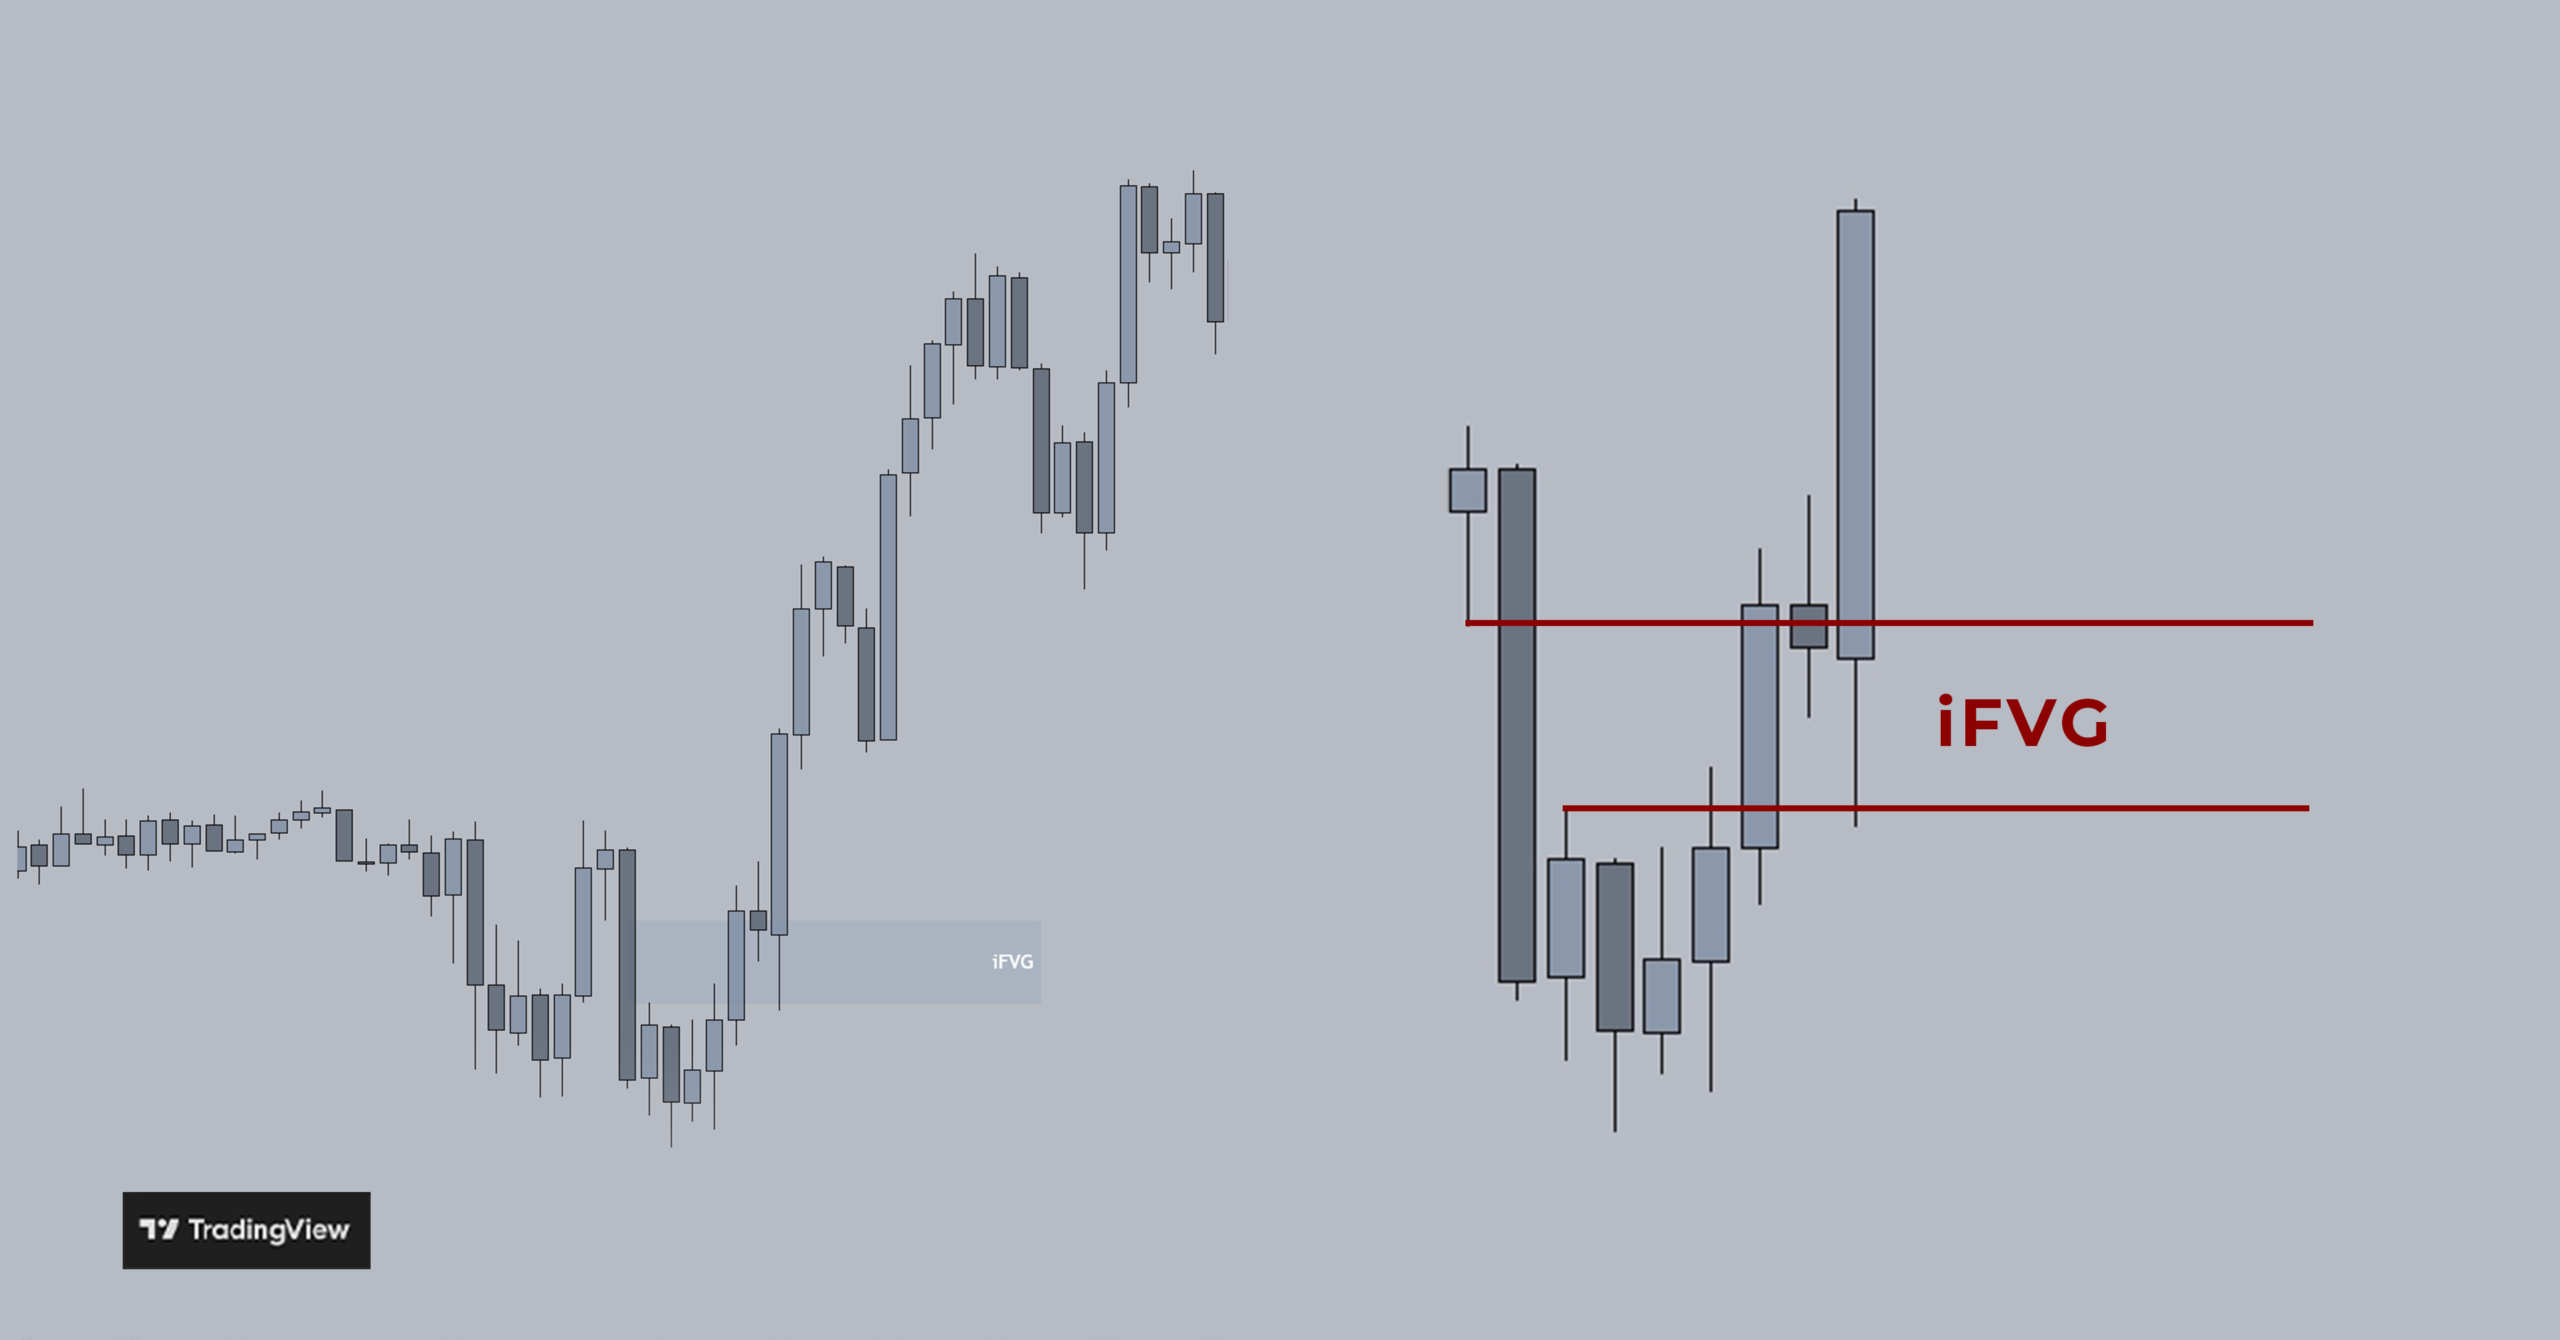
An inversion fair value gap is a fair value gap that got disrespected/broken through/invalidated. Meaning a candle broke through and closed outside of it.
A bullish iFVG is a bearish FVG that got invalidated.
A bearish iFVG is a bullish FVG that got invalidated.
It indicates a change in direction and can therefore be used to identify the draw on liquidity or to find a bias.
iFVGs can also be combined with other concepts to create an entry model.
charts by TradingView
CISD: change in the state of delivery
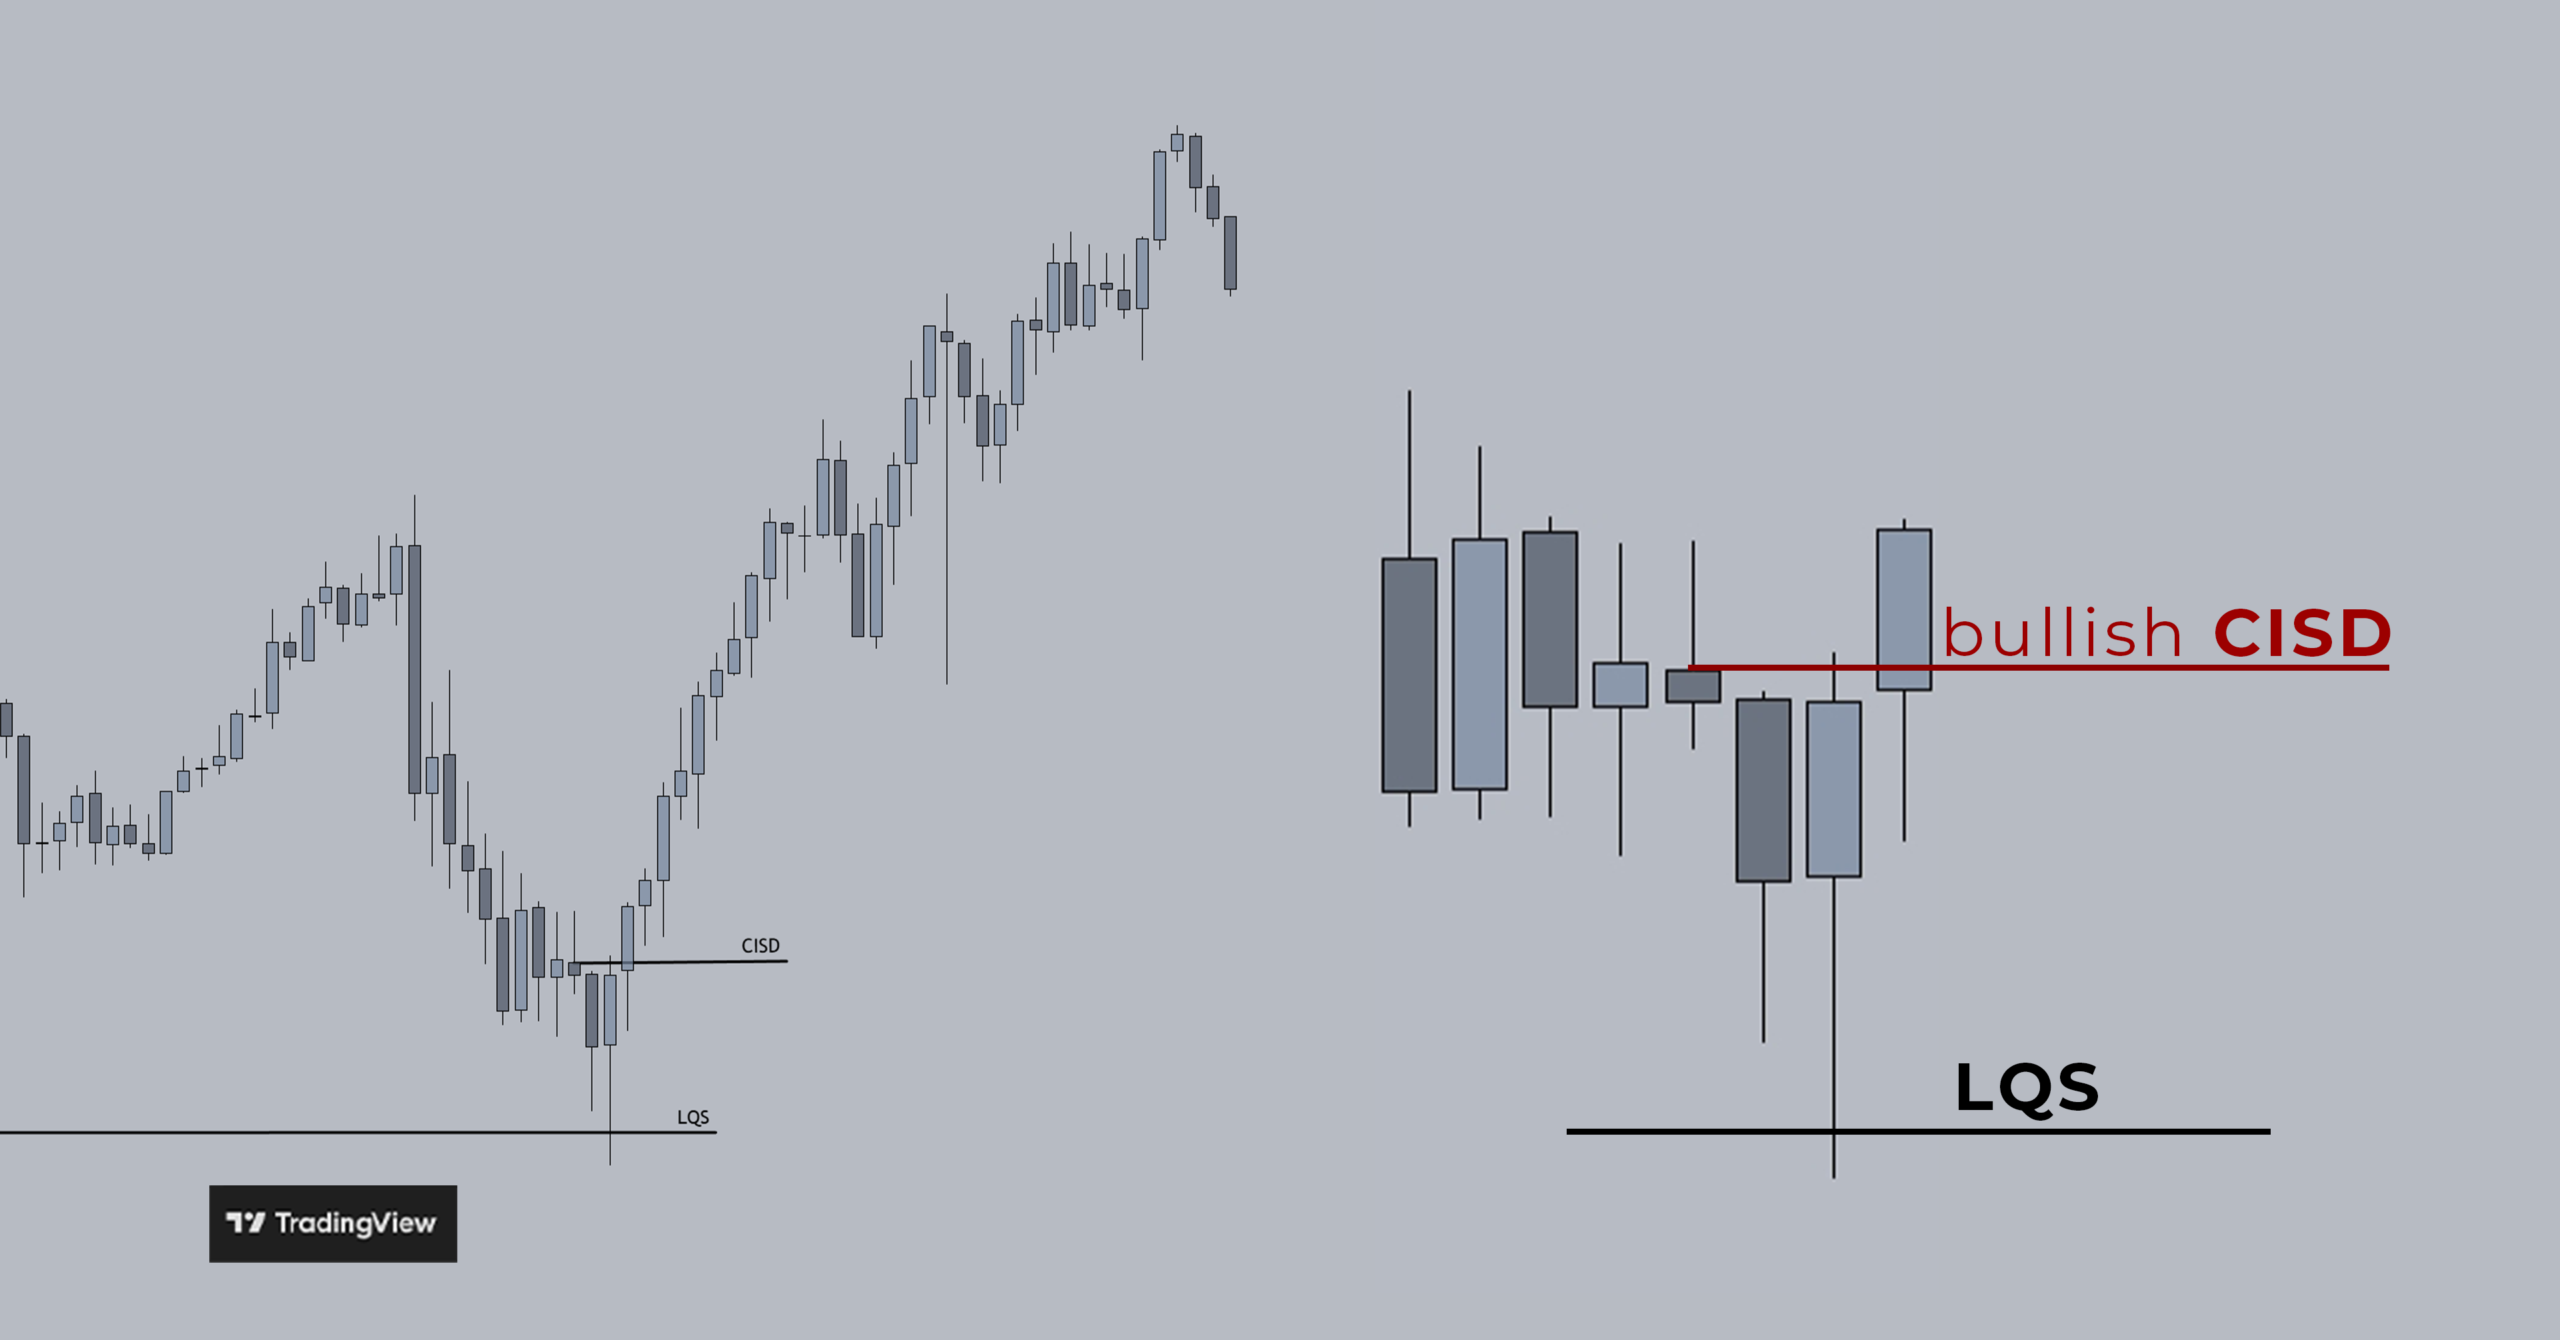
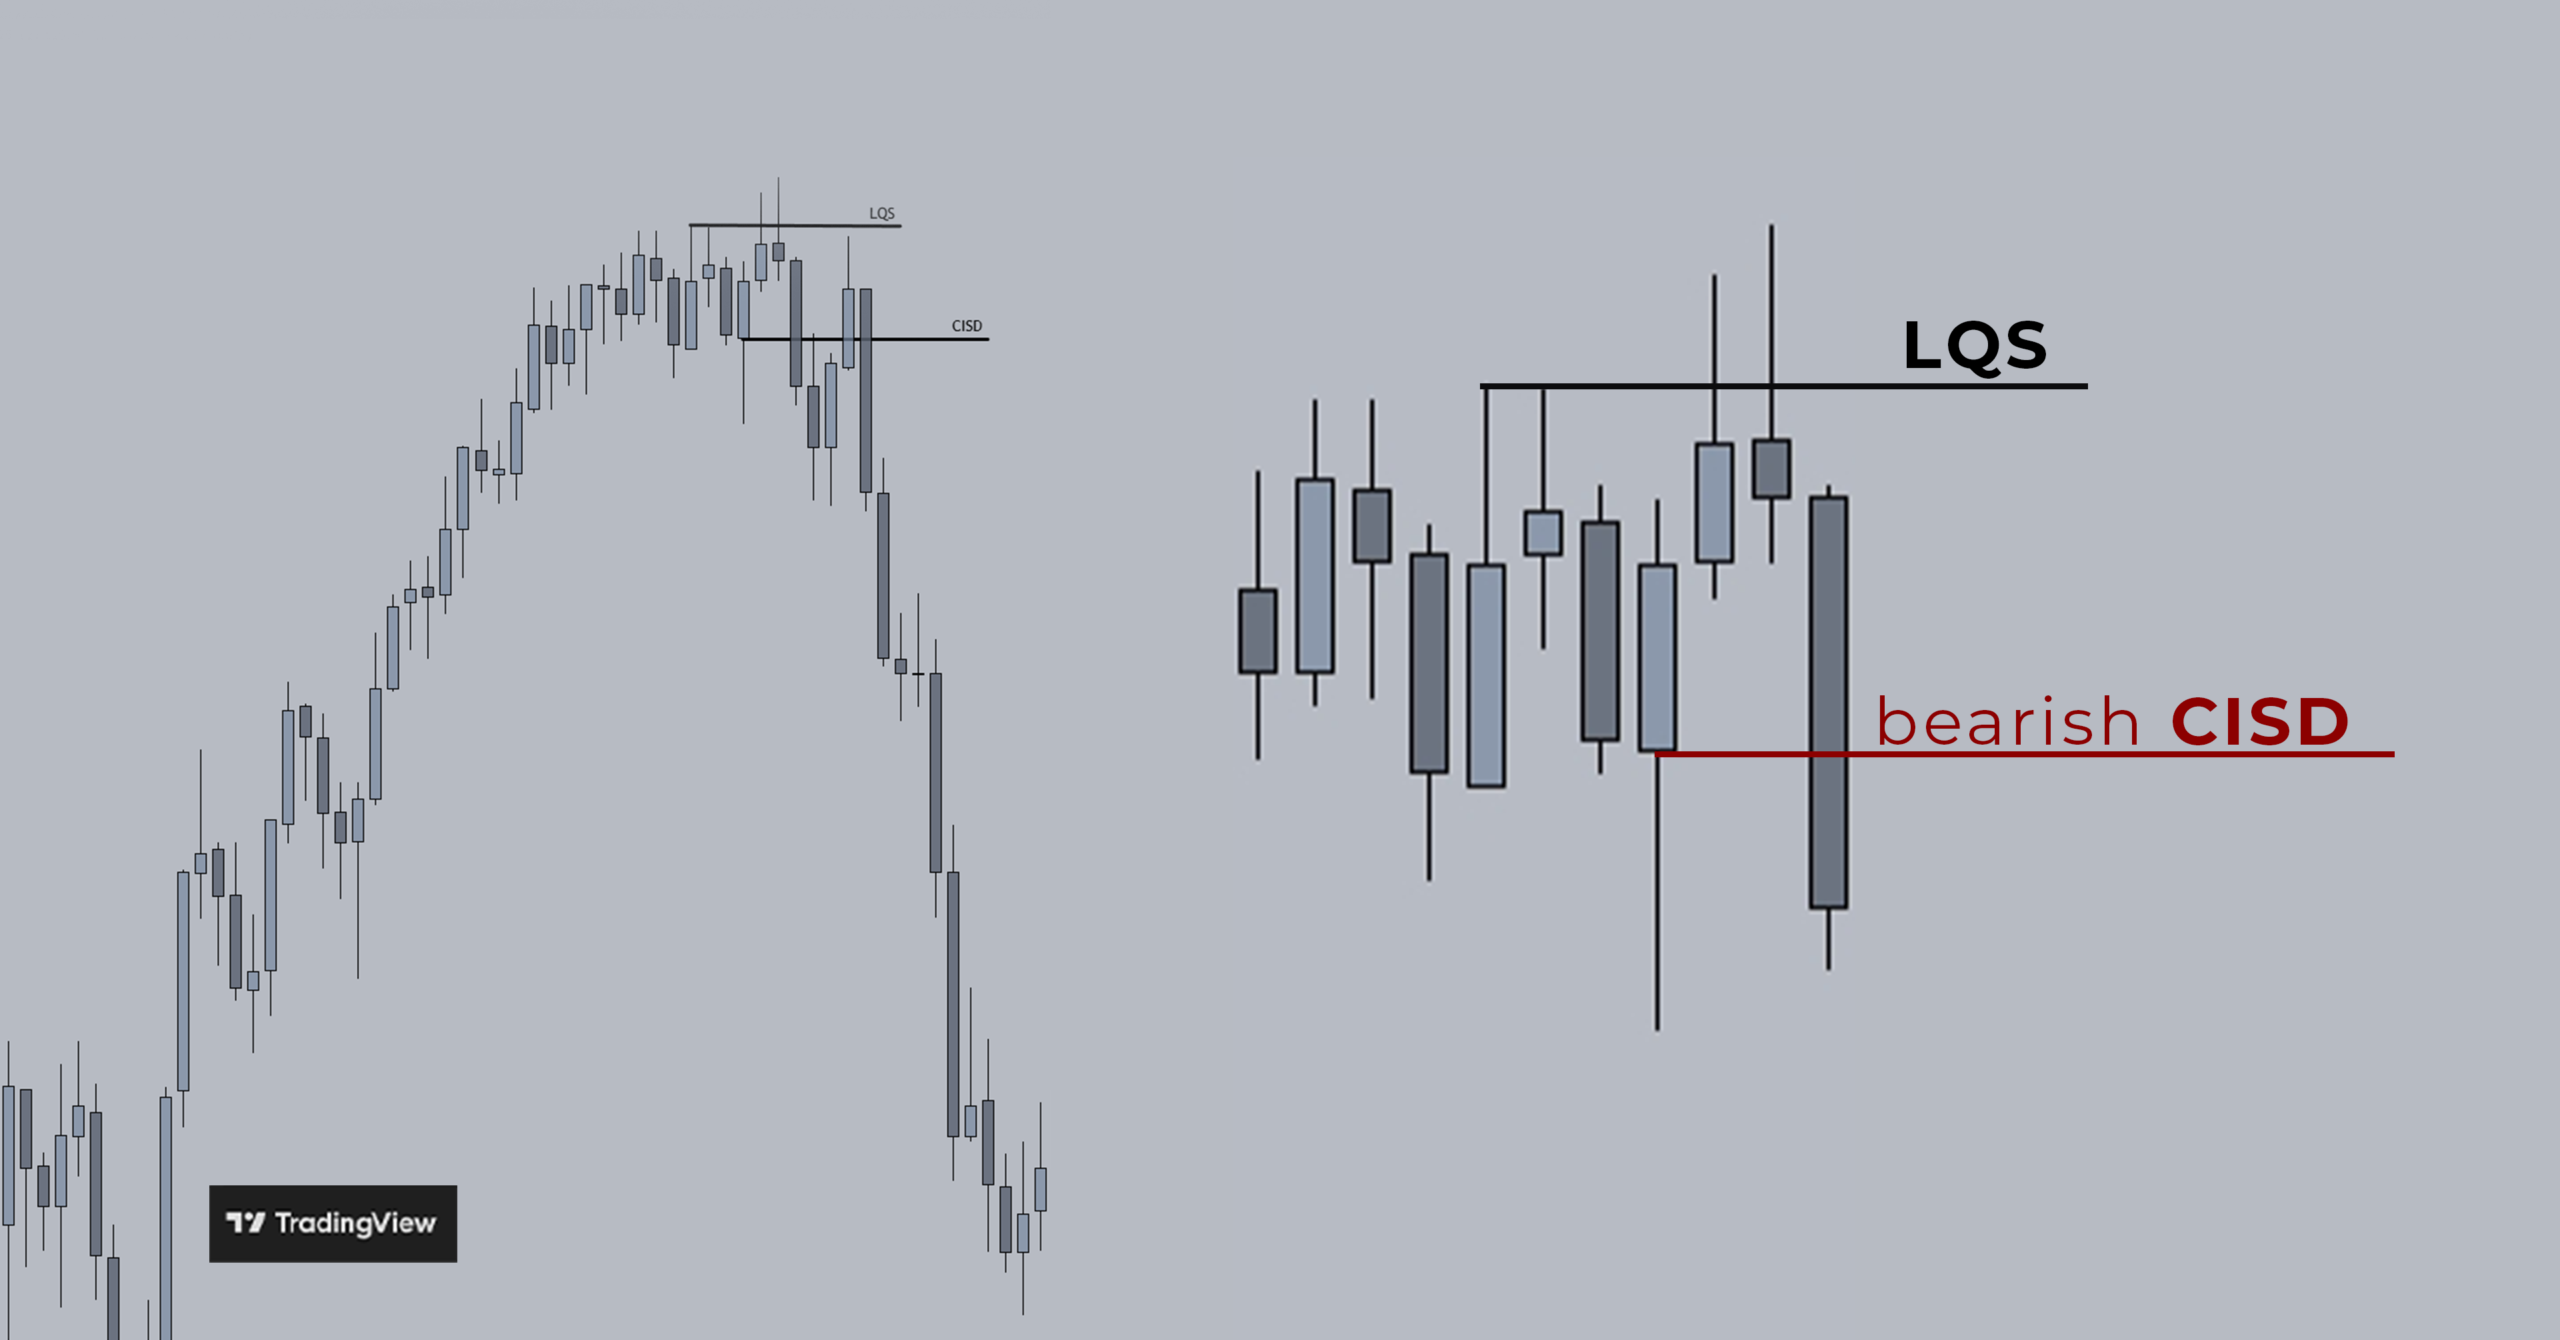
A change in the state of delivery occurs when price breaks and closes above or below the recent series of up-close or down-close candles after sweeping liquidity or delivering from a fair value gap.
It indicates a shift in direction.
Bullish CISD:
Price breaks and closes above the body of the last bearish candle of the prior bearish delivery leg after sweeping liquidity or delivering from a fair value gap.
charts by TradingView
Bearish CISD:
Price breaks and closes below the body of the last bullish candle of the prior bullish delivery leg after sweeping liquidity or delivering from a fair value gap.
charts by TradingView
A CISD can be used for entries, to find a bias and to determine the draw of liquidity. It can also be combined with other concepts to create an entry model.
VI: Volume imbalance
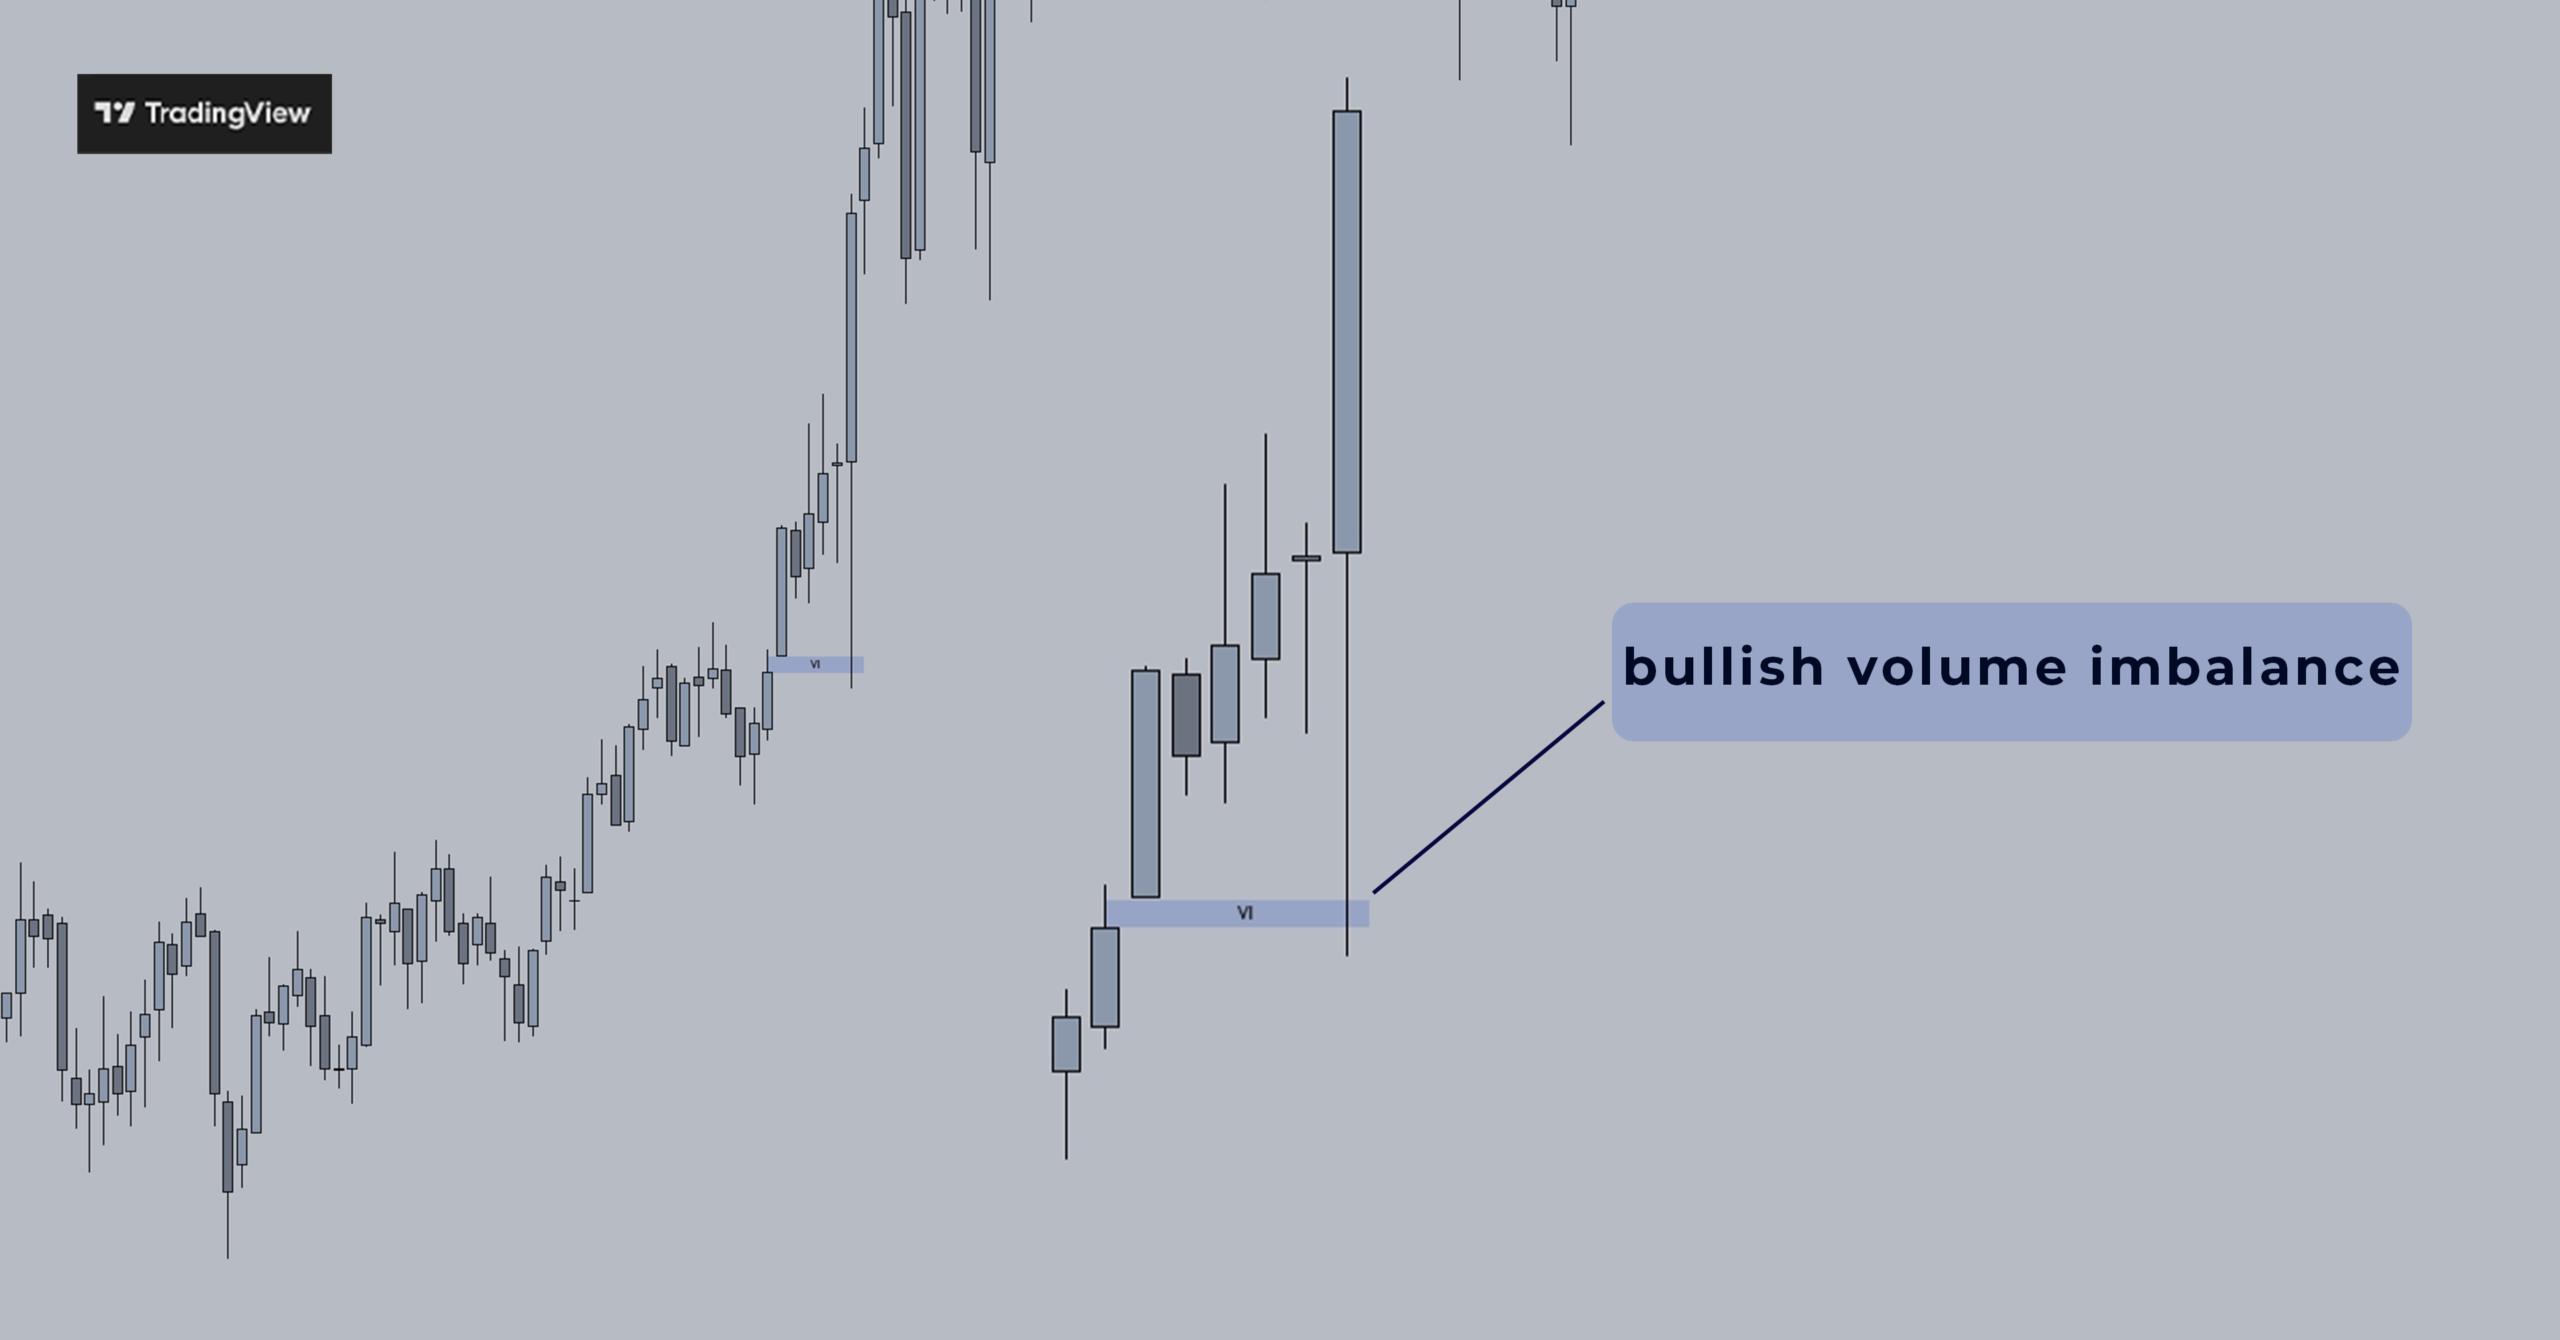
Like a fair value gap, a volume imbalance represents an imbalance in price caused by an aggressive price movement.
If there is a gap between the bodies of two candles, there is a volume imbalance.
Bullish volume imbalance:
The second candle opens at a higher price than the closing price of the previous candle, leaving a gap between the bodies, representing aggressive buying.
charts by TradingView
Bearish volume imbalance:
The second candle opens at a lower price than the closing price of the previous candle, leaving a gap between the bodies, representing aggressive selling.
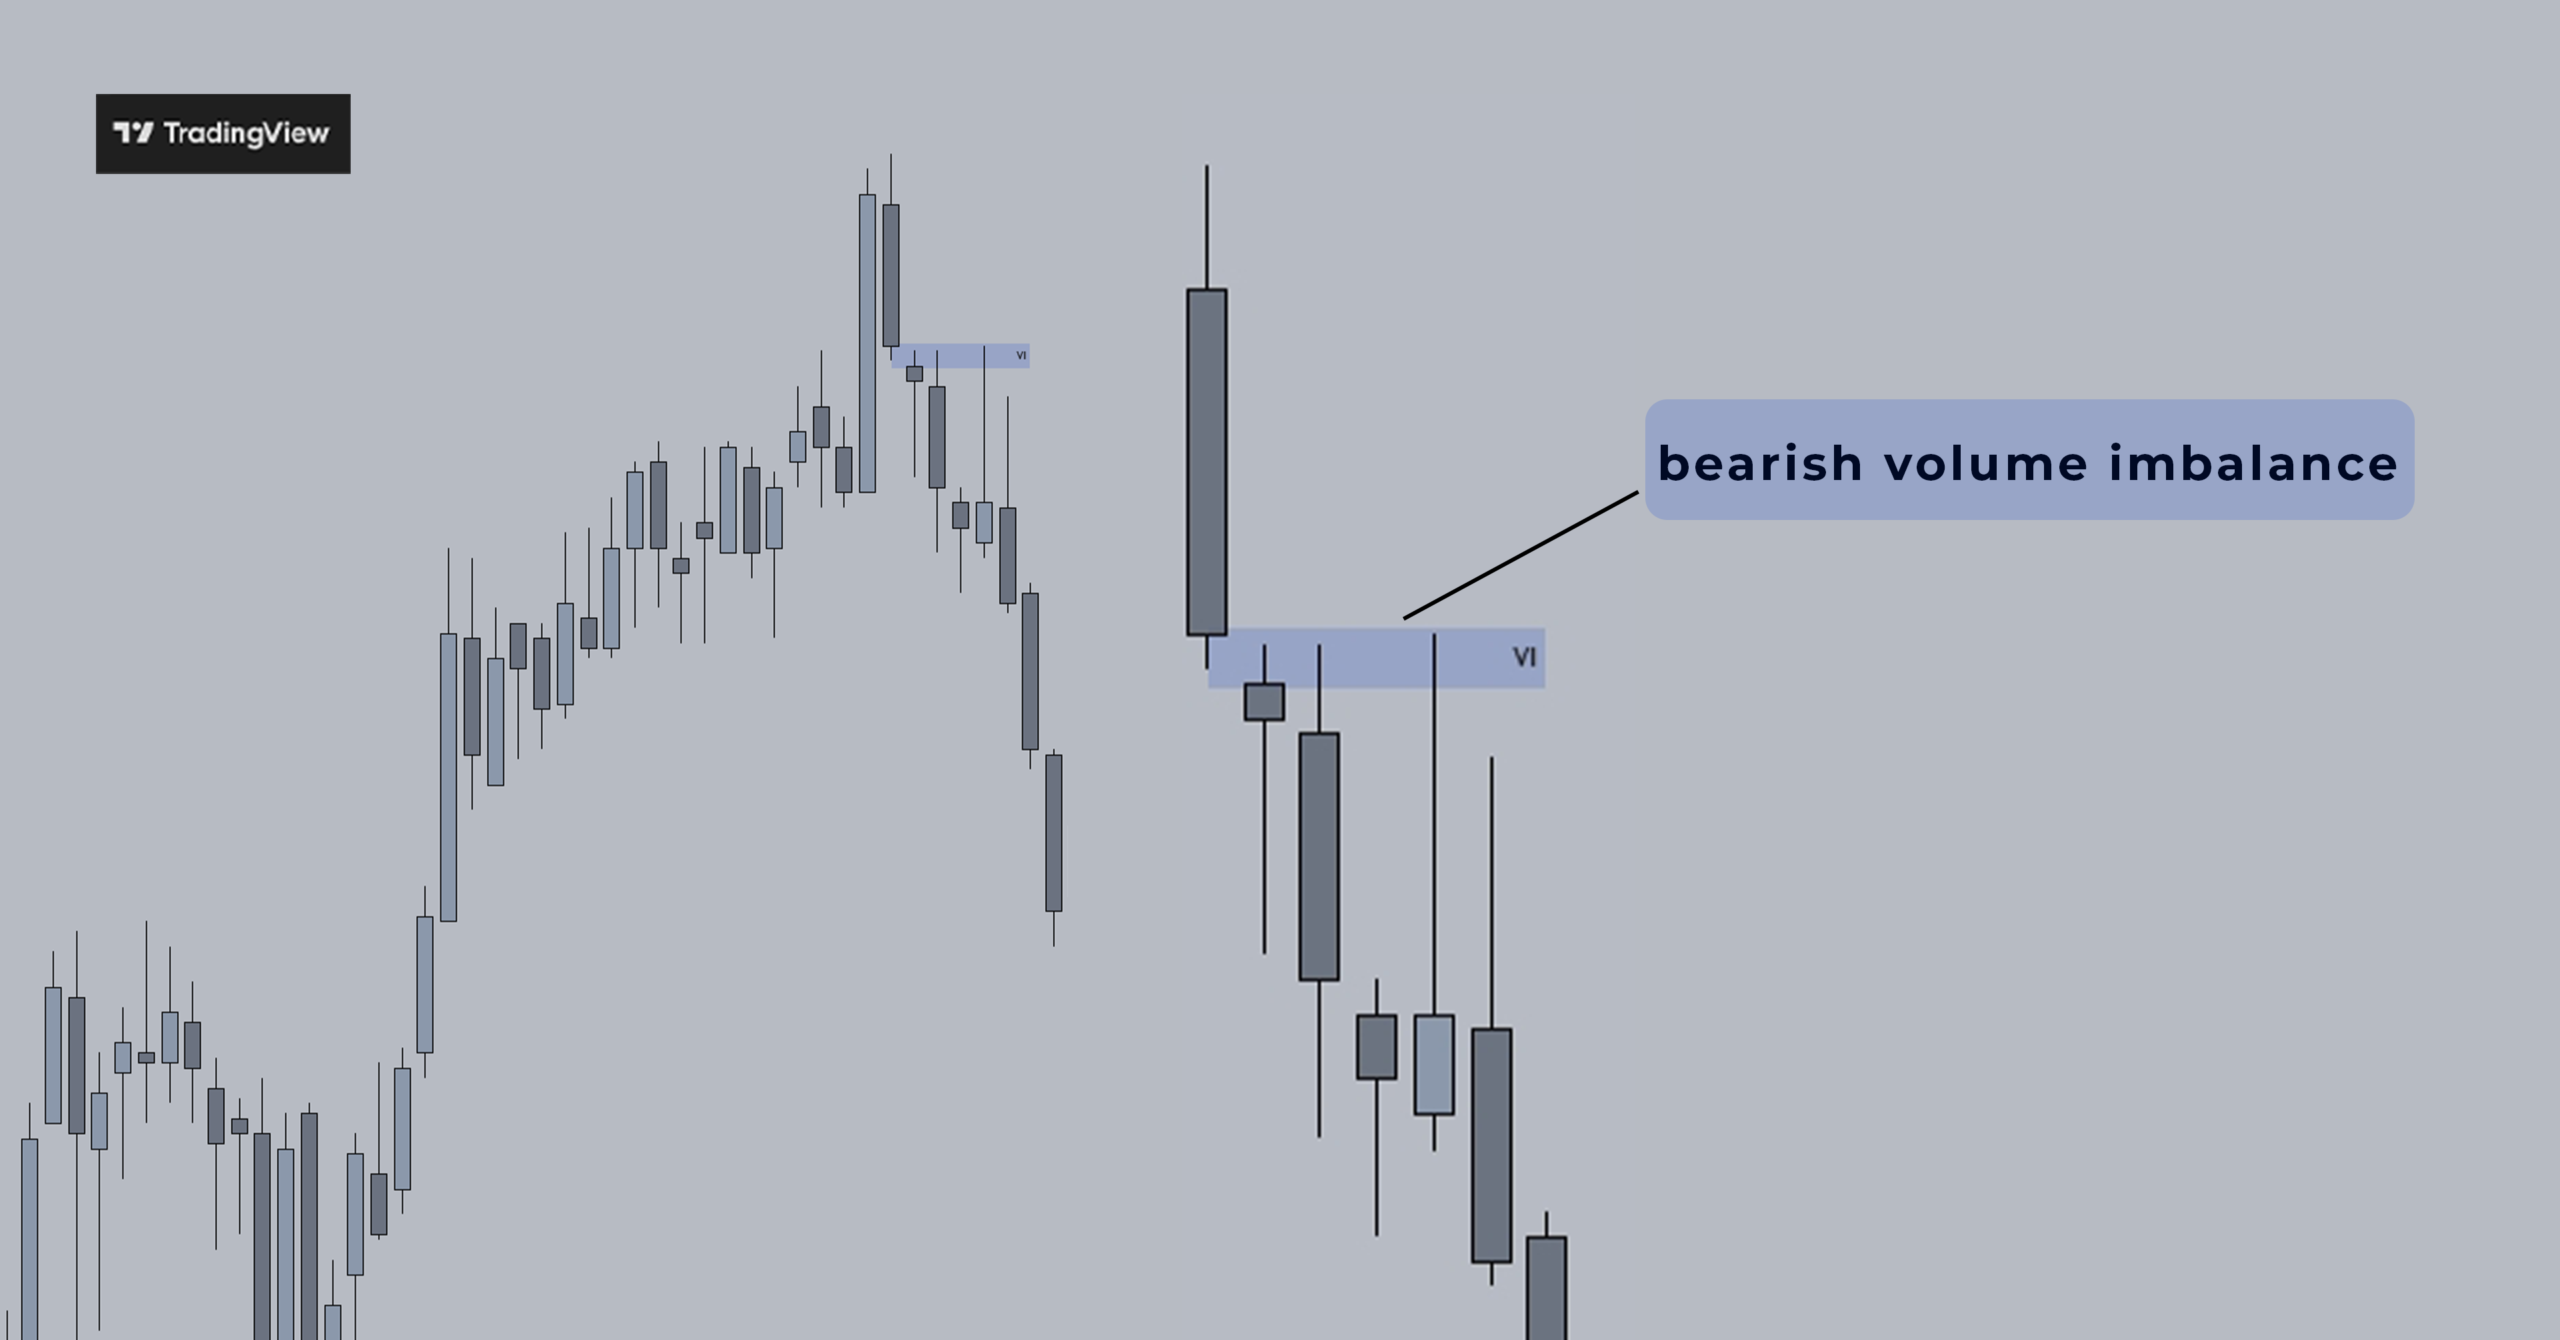
charts by TradingView
Volume imbalances act like magnets as well. Most of the time, price comes back to that level to rebalance price.
OB: Order block
An order block is the last opposing candle before a strong displacement or impulsive move.
Bullish OB:
A bullish order block is the last bearish candle before a strong displacement or impulsive move up.
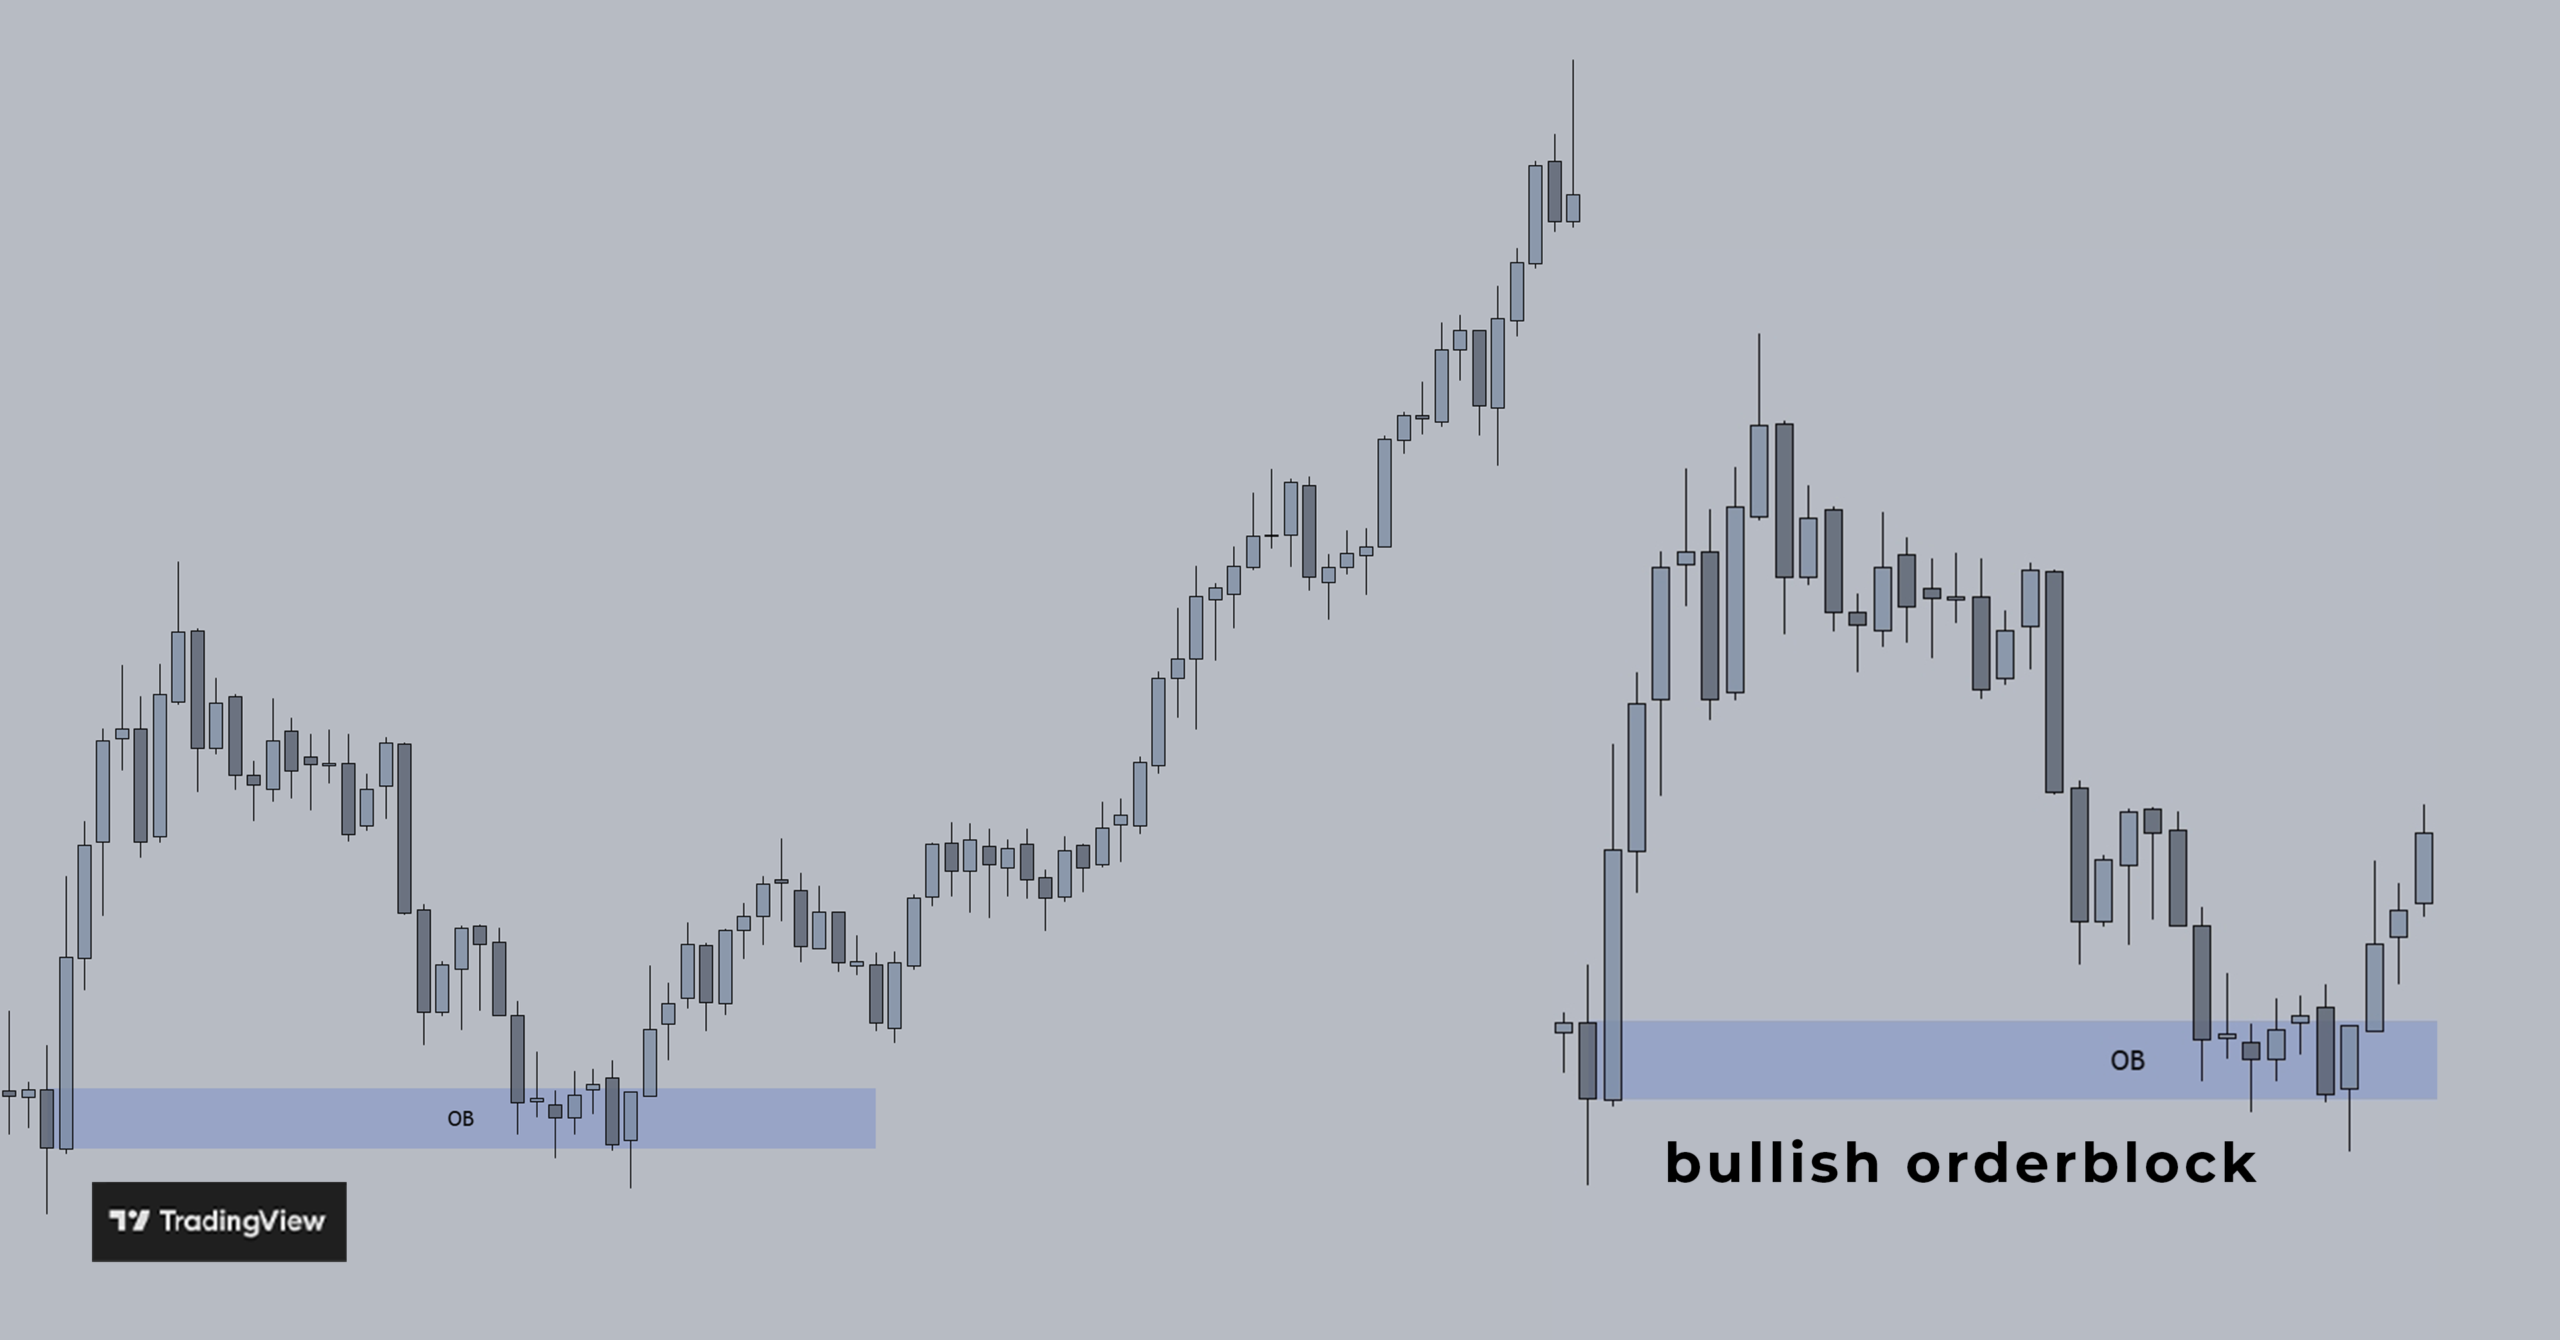
charts by TradingView
Bearish OB:
A bearish order block is the last bullish candle before a strong displacement or impulsive move down.
You can mark an OB out from wick to wick when the candle body is small and just the candle body when the candle is big.
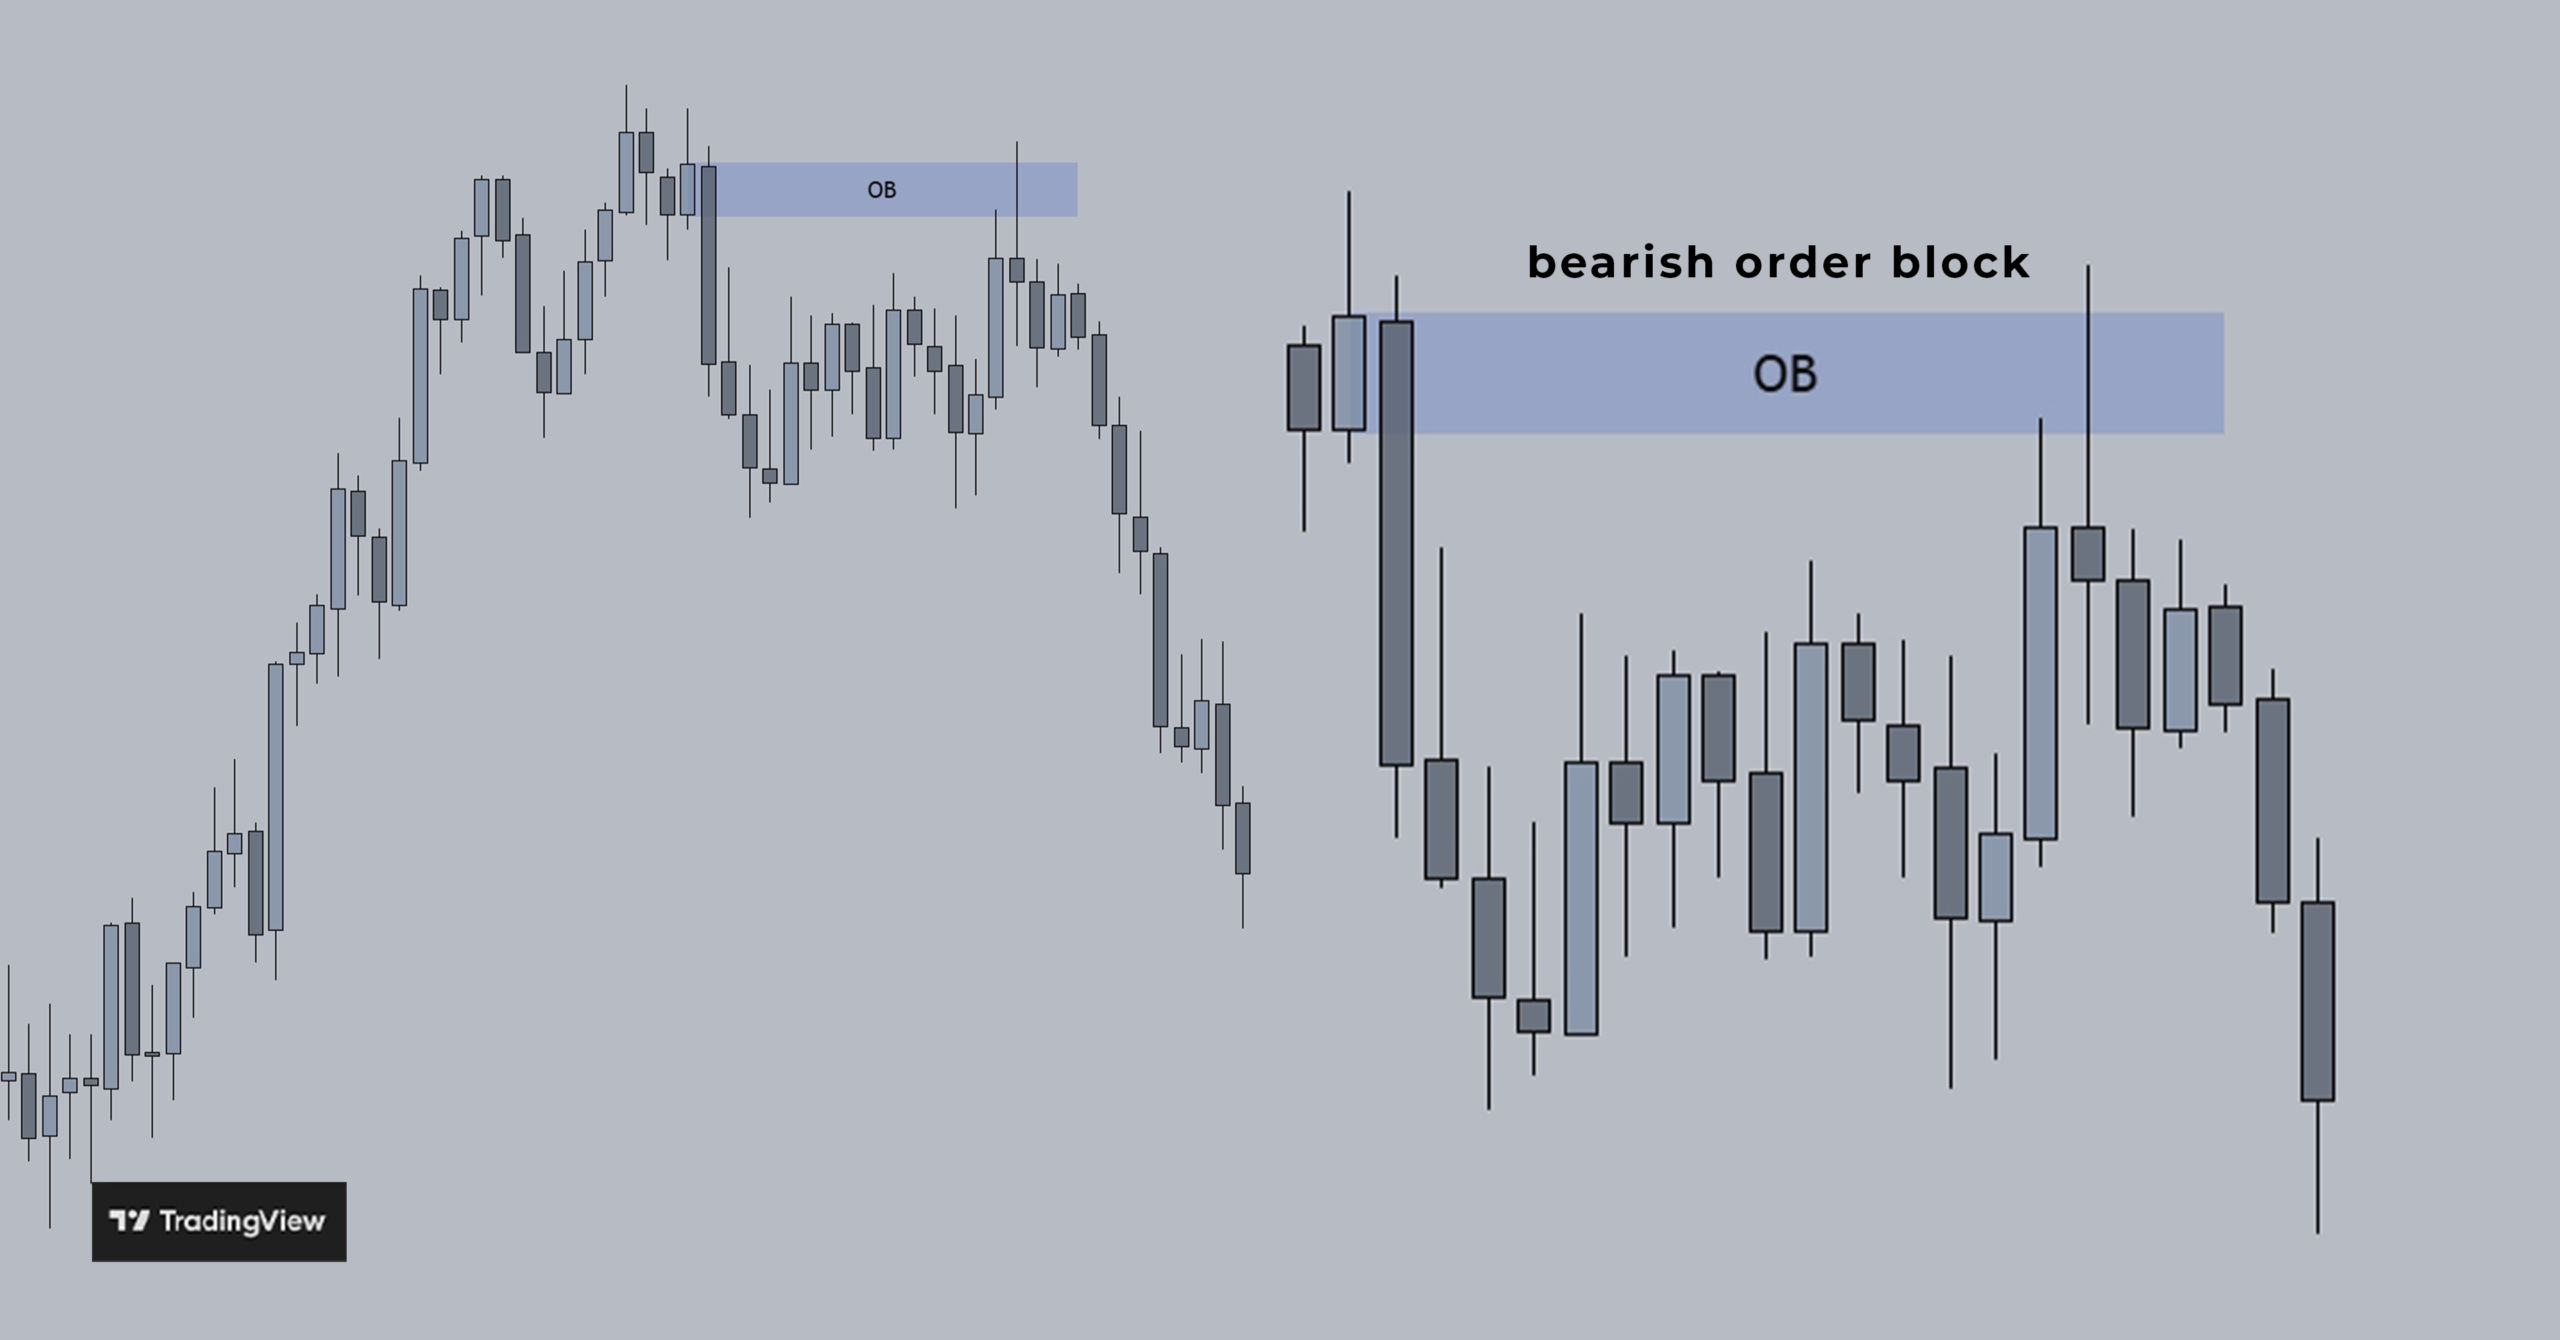
charts by TradingView
A lot of the time, price will retrace back into an order block and then continue it‘s move.
An OB can be used for entries, to identify the draw on liquidity and to find a bias.
It can also be combined with other concepts to create an entry model.
MSS: Market structure shift
A market structure shift occurs when price closes above a swing high or below a swing low after sweeping liquidity or delivering from a fair value gap. It usually occurs after a CISD and indicates a change in direction.
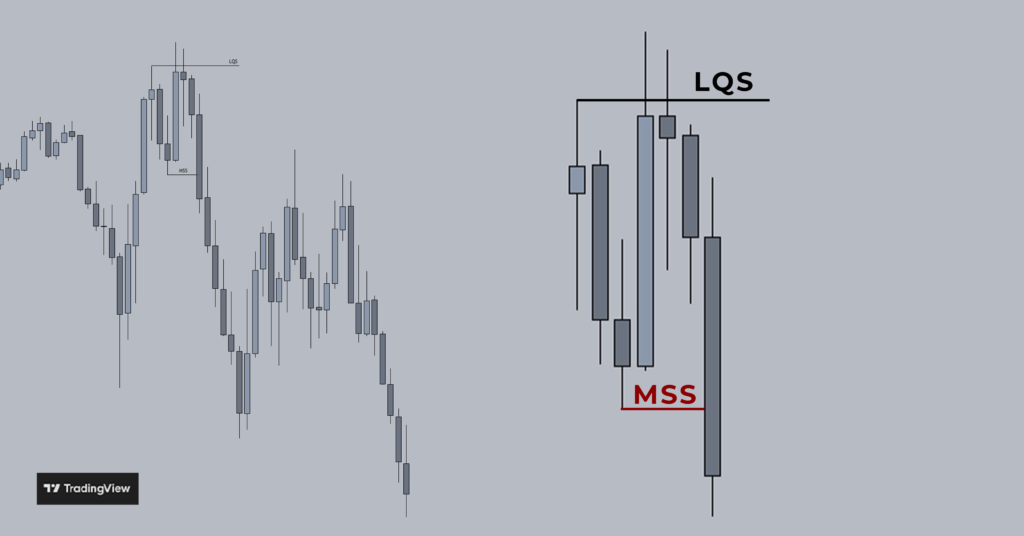
charts by TradingView
A bullish MSS is created when price closes above a swing high and a bearish MSS is created when price closes below a swing low.
An MSS can be used for entries, to identify the draw on liquidity and to find a bias.
It can also be combined with other concepts to create an entry model.
BRKR/BB: Breaker block
Bullish BRKR:
A bullish breaker block is created when the market puts in a lower low followed by break and close above the high from which the downward leg that created the lower low originated from (the swing high that formed between the two lows).
The last bullish candle or series of up-close candles that put in the swing high is the bullish order block. Mark it out from wick to wick.
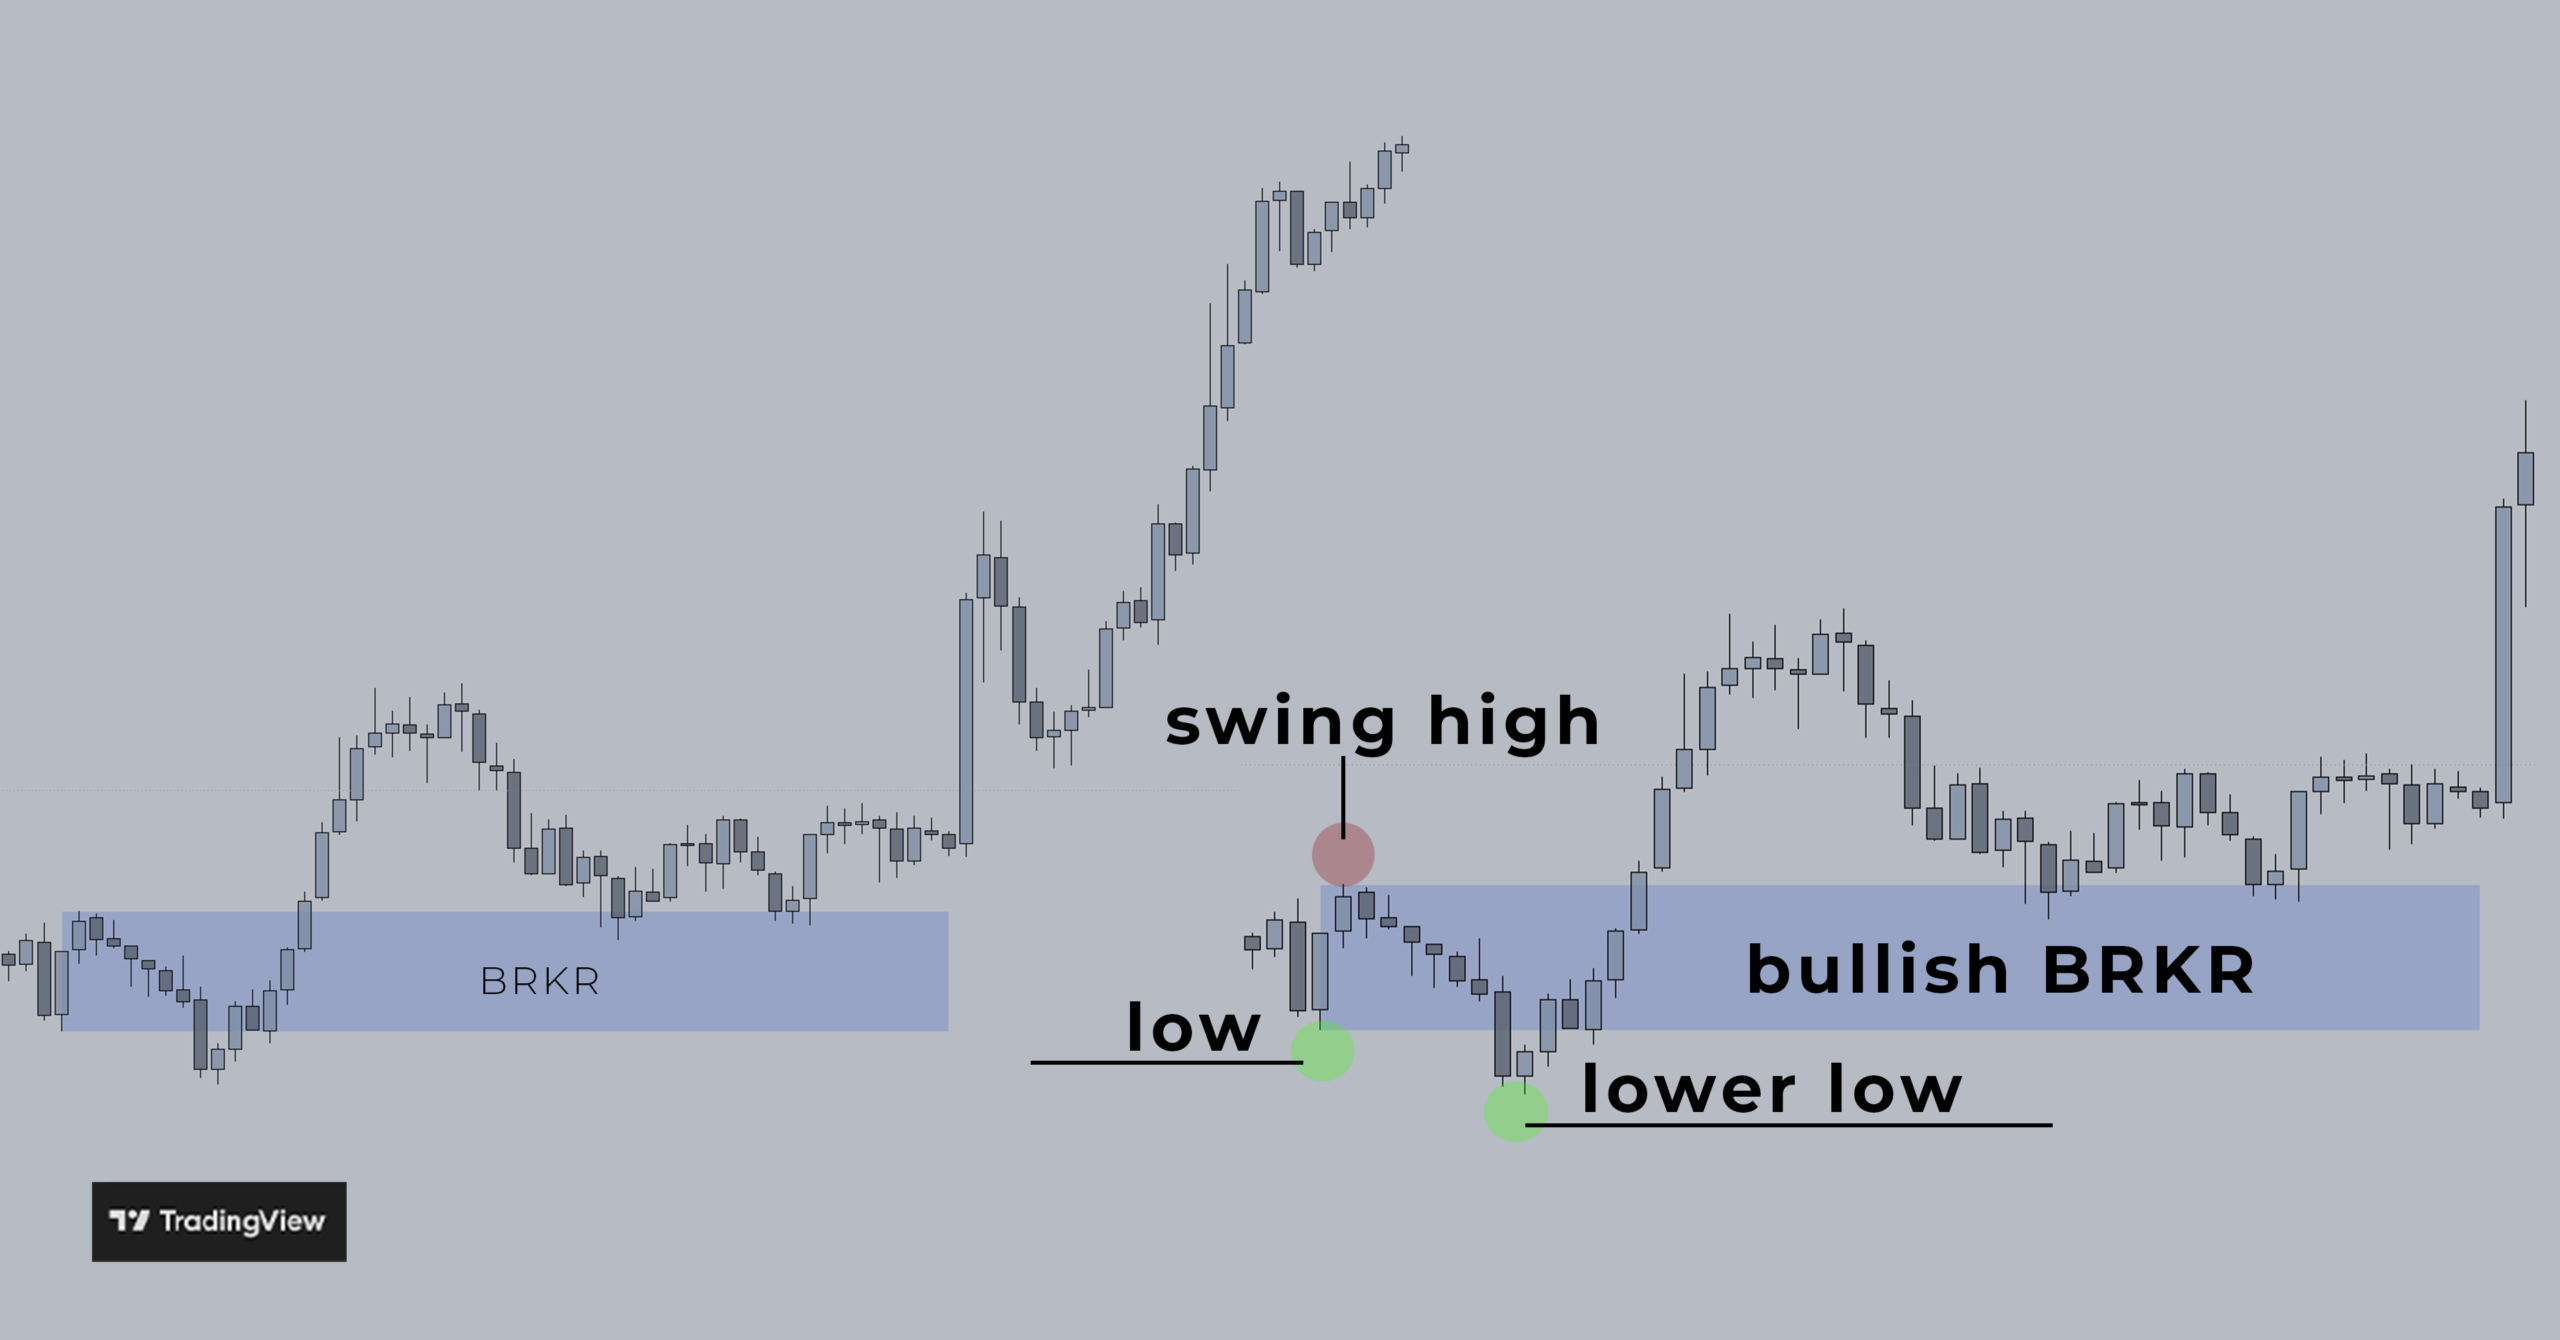
charts by TradingView
Bearish BRKR:
A bearish breaker block is created when the market puts in a higher high followed by break and close below the swing low from which the upward leg that created the higher high originated from ( (the swing low that formed between the two highs).
The last bearish candle or series of down close candles that put in the swing low is the bearish order block. Mark it out from wick to wick.
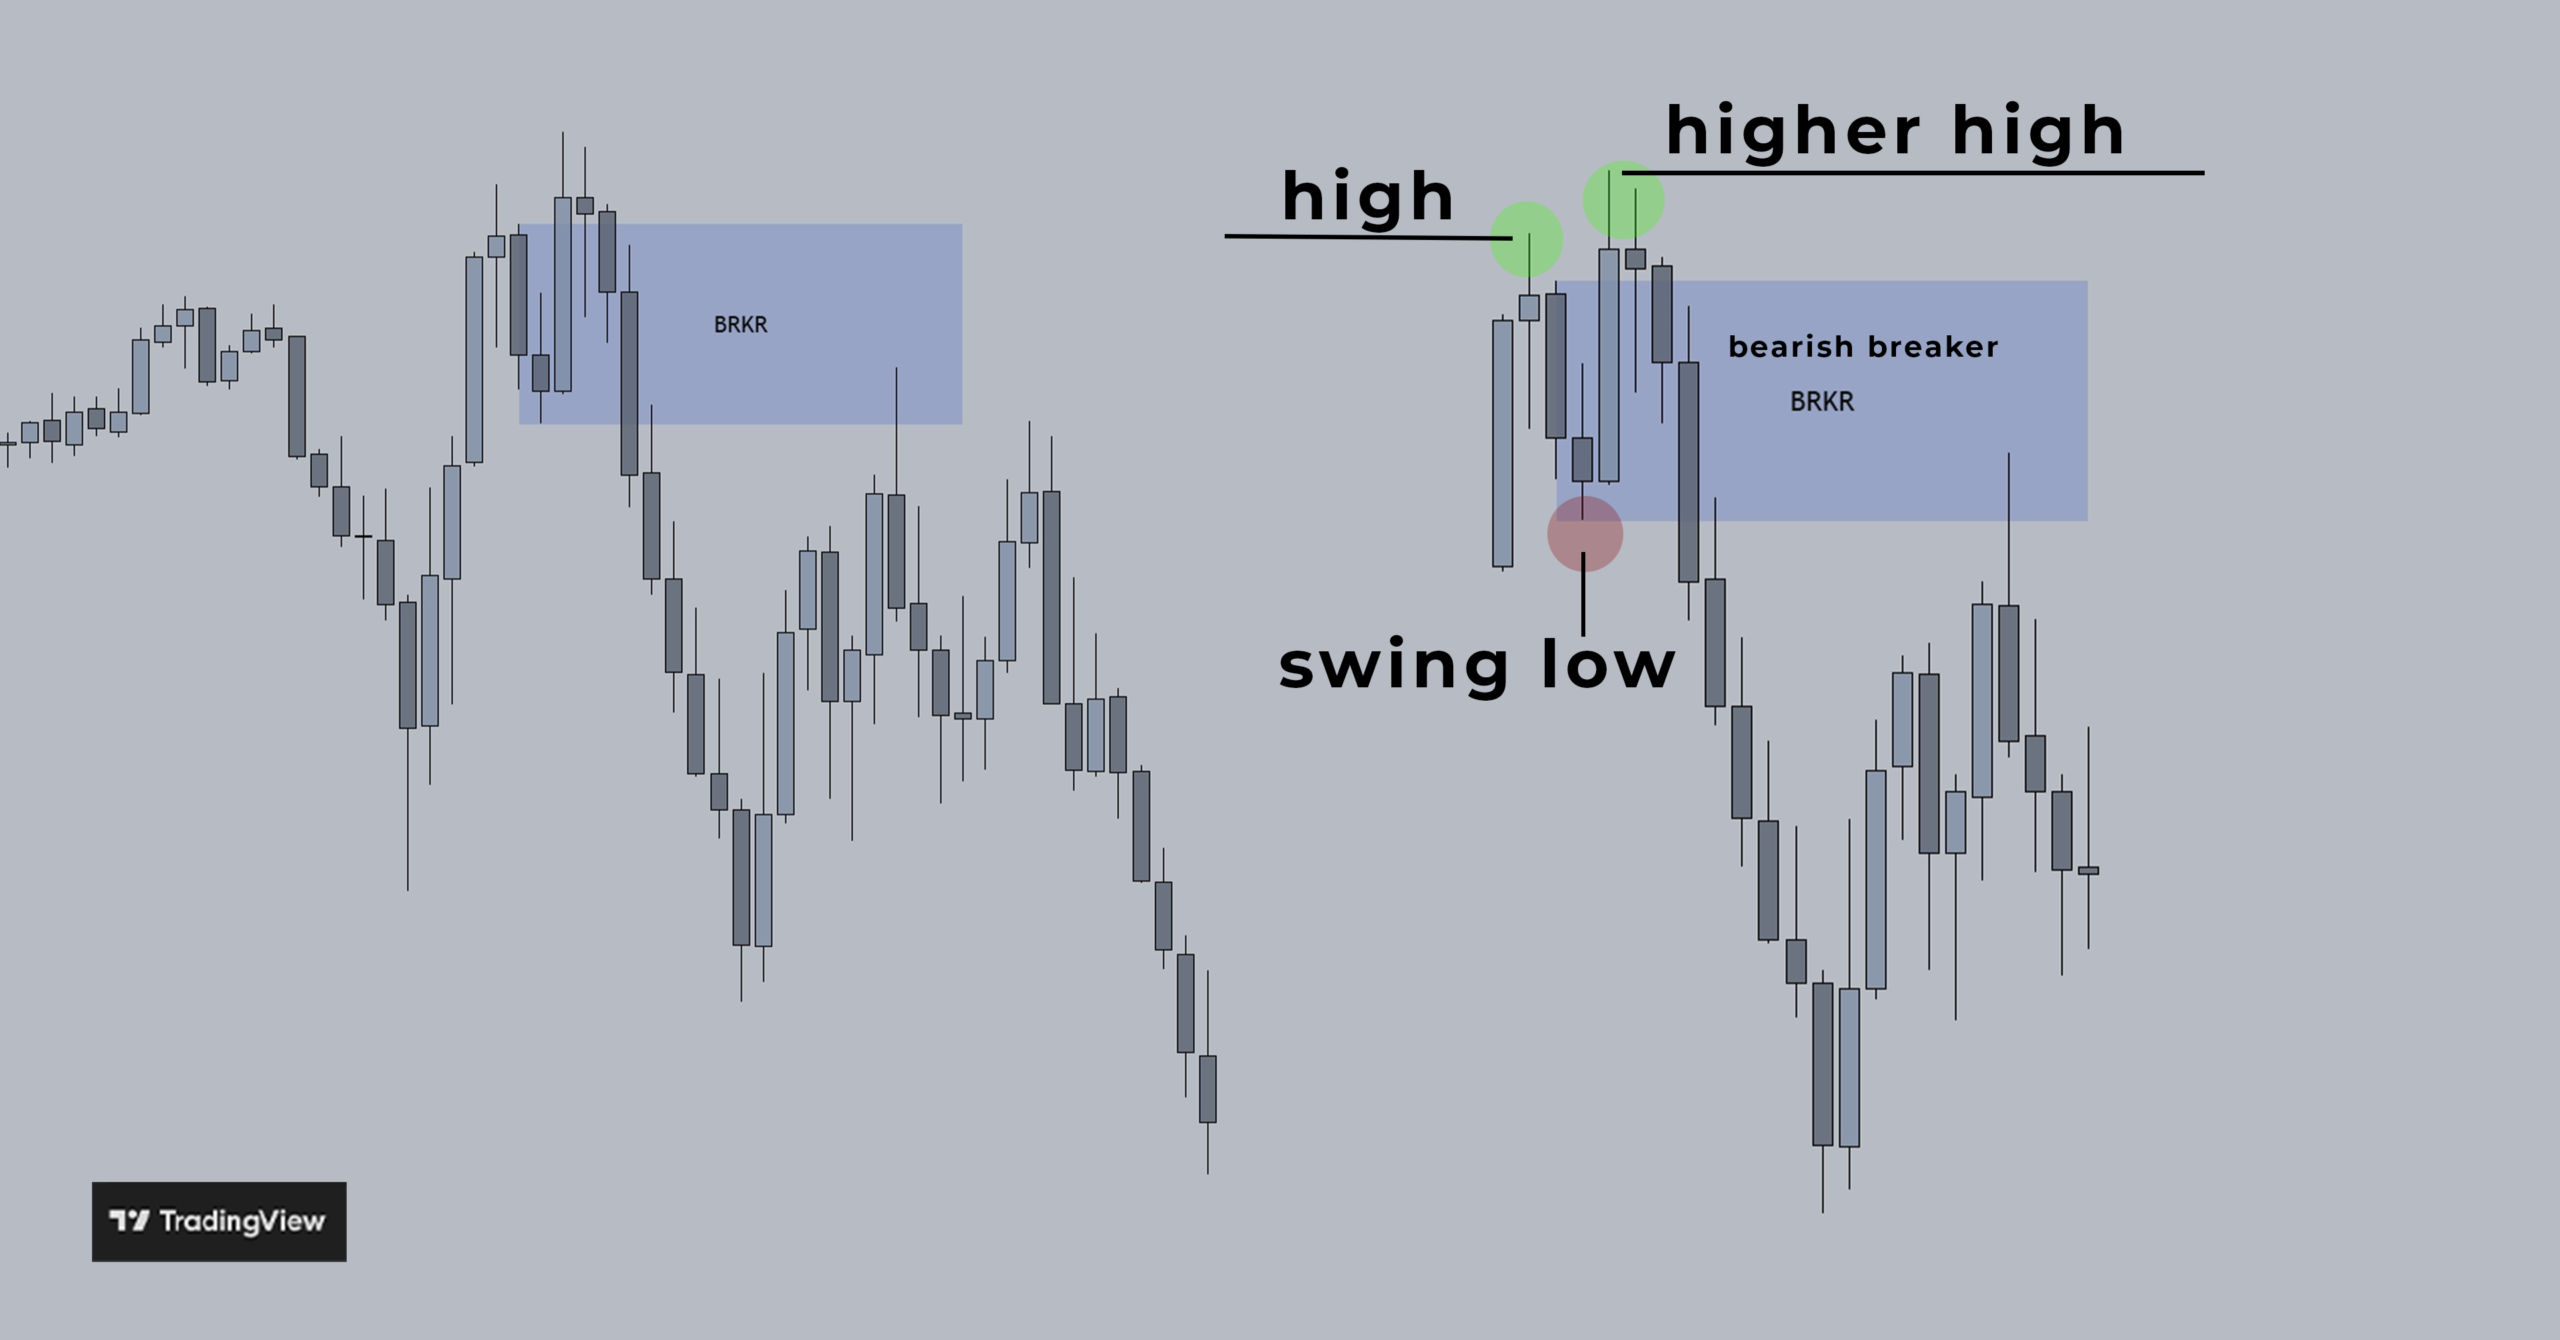
charts by TradingView
A lot of the time, price will retrace back into a breaker block and then continue it‘s move
It can be used for entries, to identify the draw on liquidity and to find a bias.
It can also be combined with other concepts to create an entry model.
EQH: equal highs
Equal highs occur when when two or more highs form at approximately the same price level. They are like a pool of buy side liquidity that act like a magnet. Most of the time price comes back to that liquidity pool.
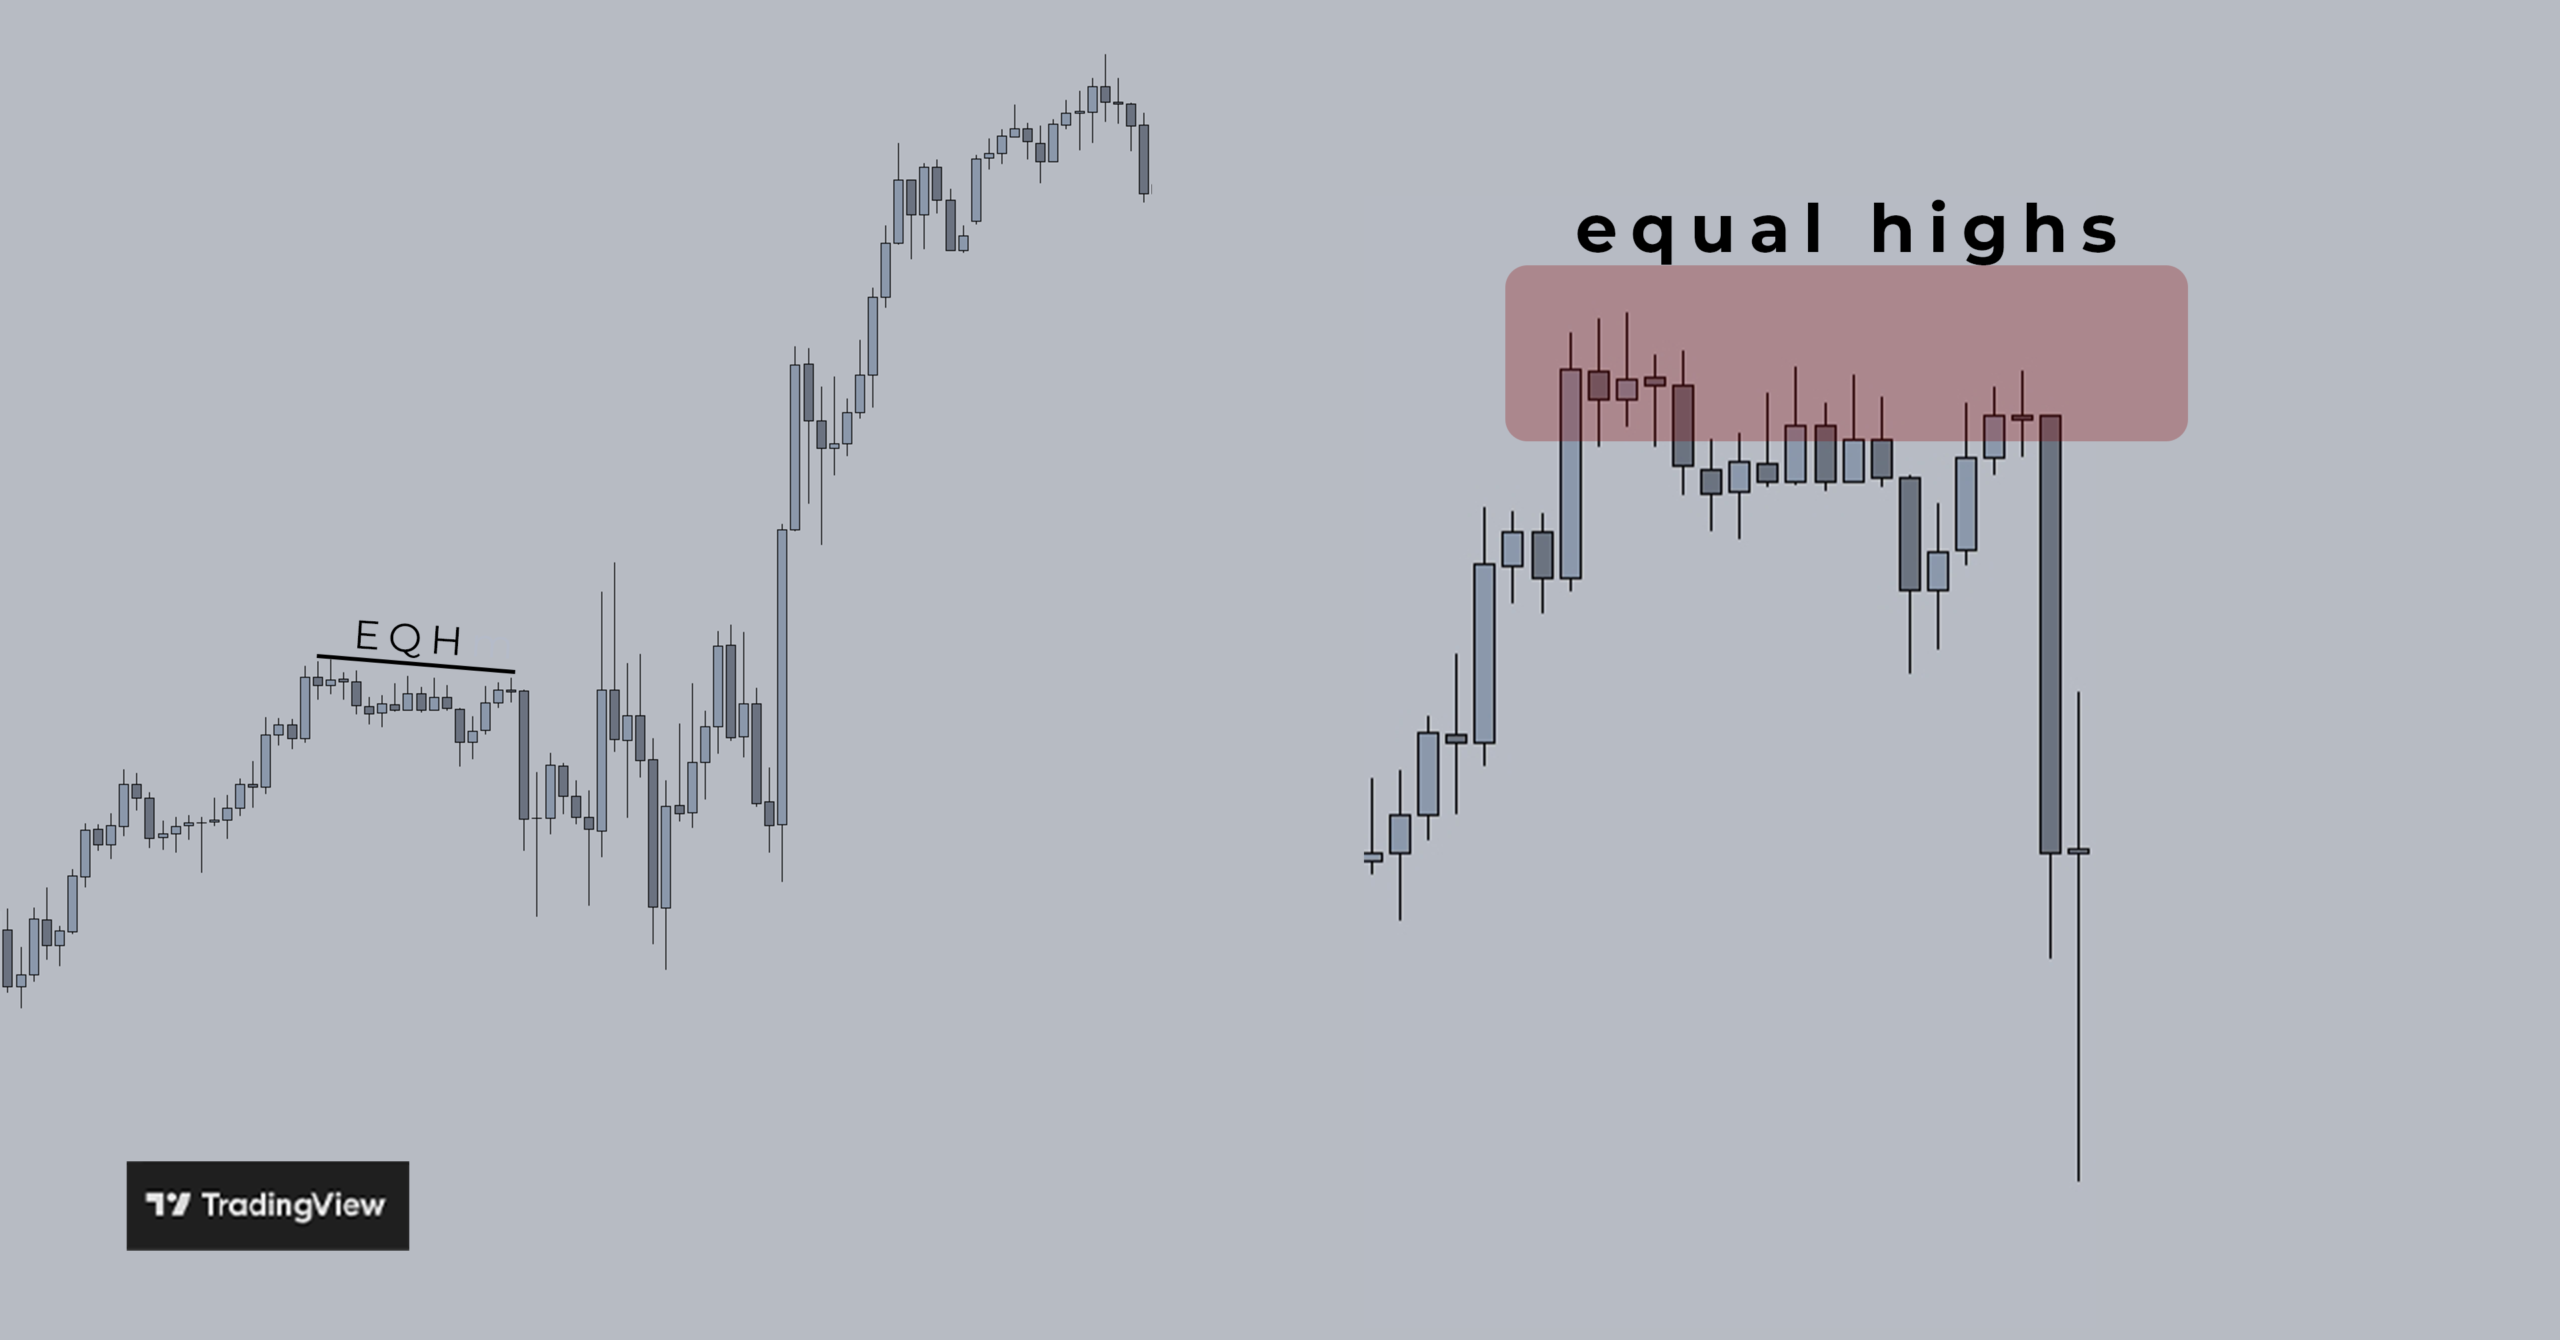
charts by TradingView
equal highs can be a point of interest from which a short setup might form or be used as targets.
EQL: equal lows
Equal lows occur when when two or more lows form at approximately the same price level. They are like a pool of sell side liquidity that act like a magnet. Most of the time price comes back to that liquidity pool.
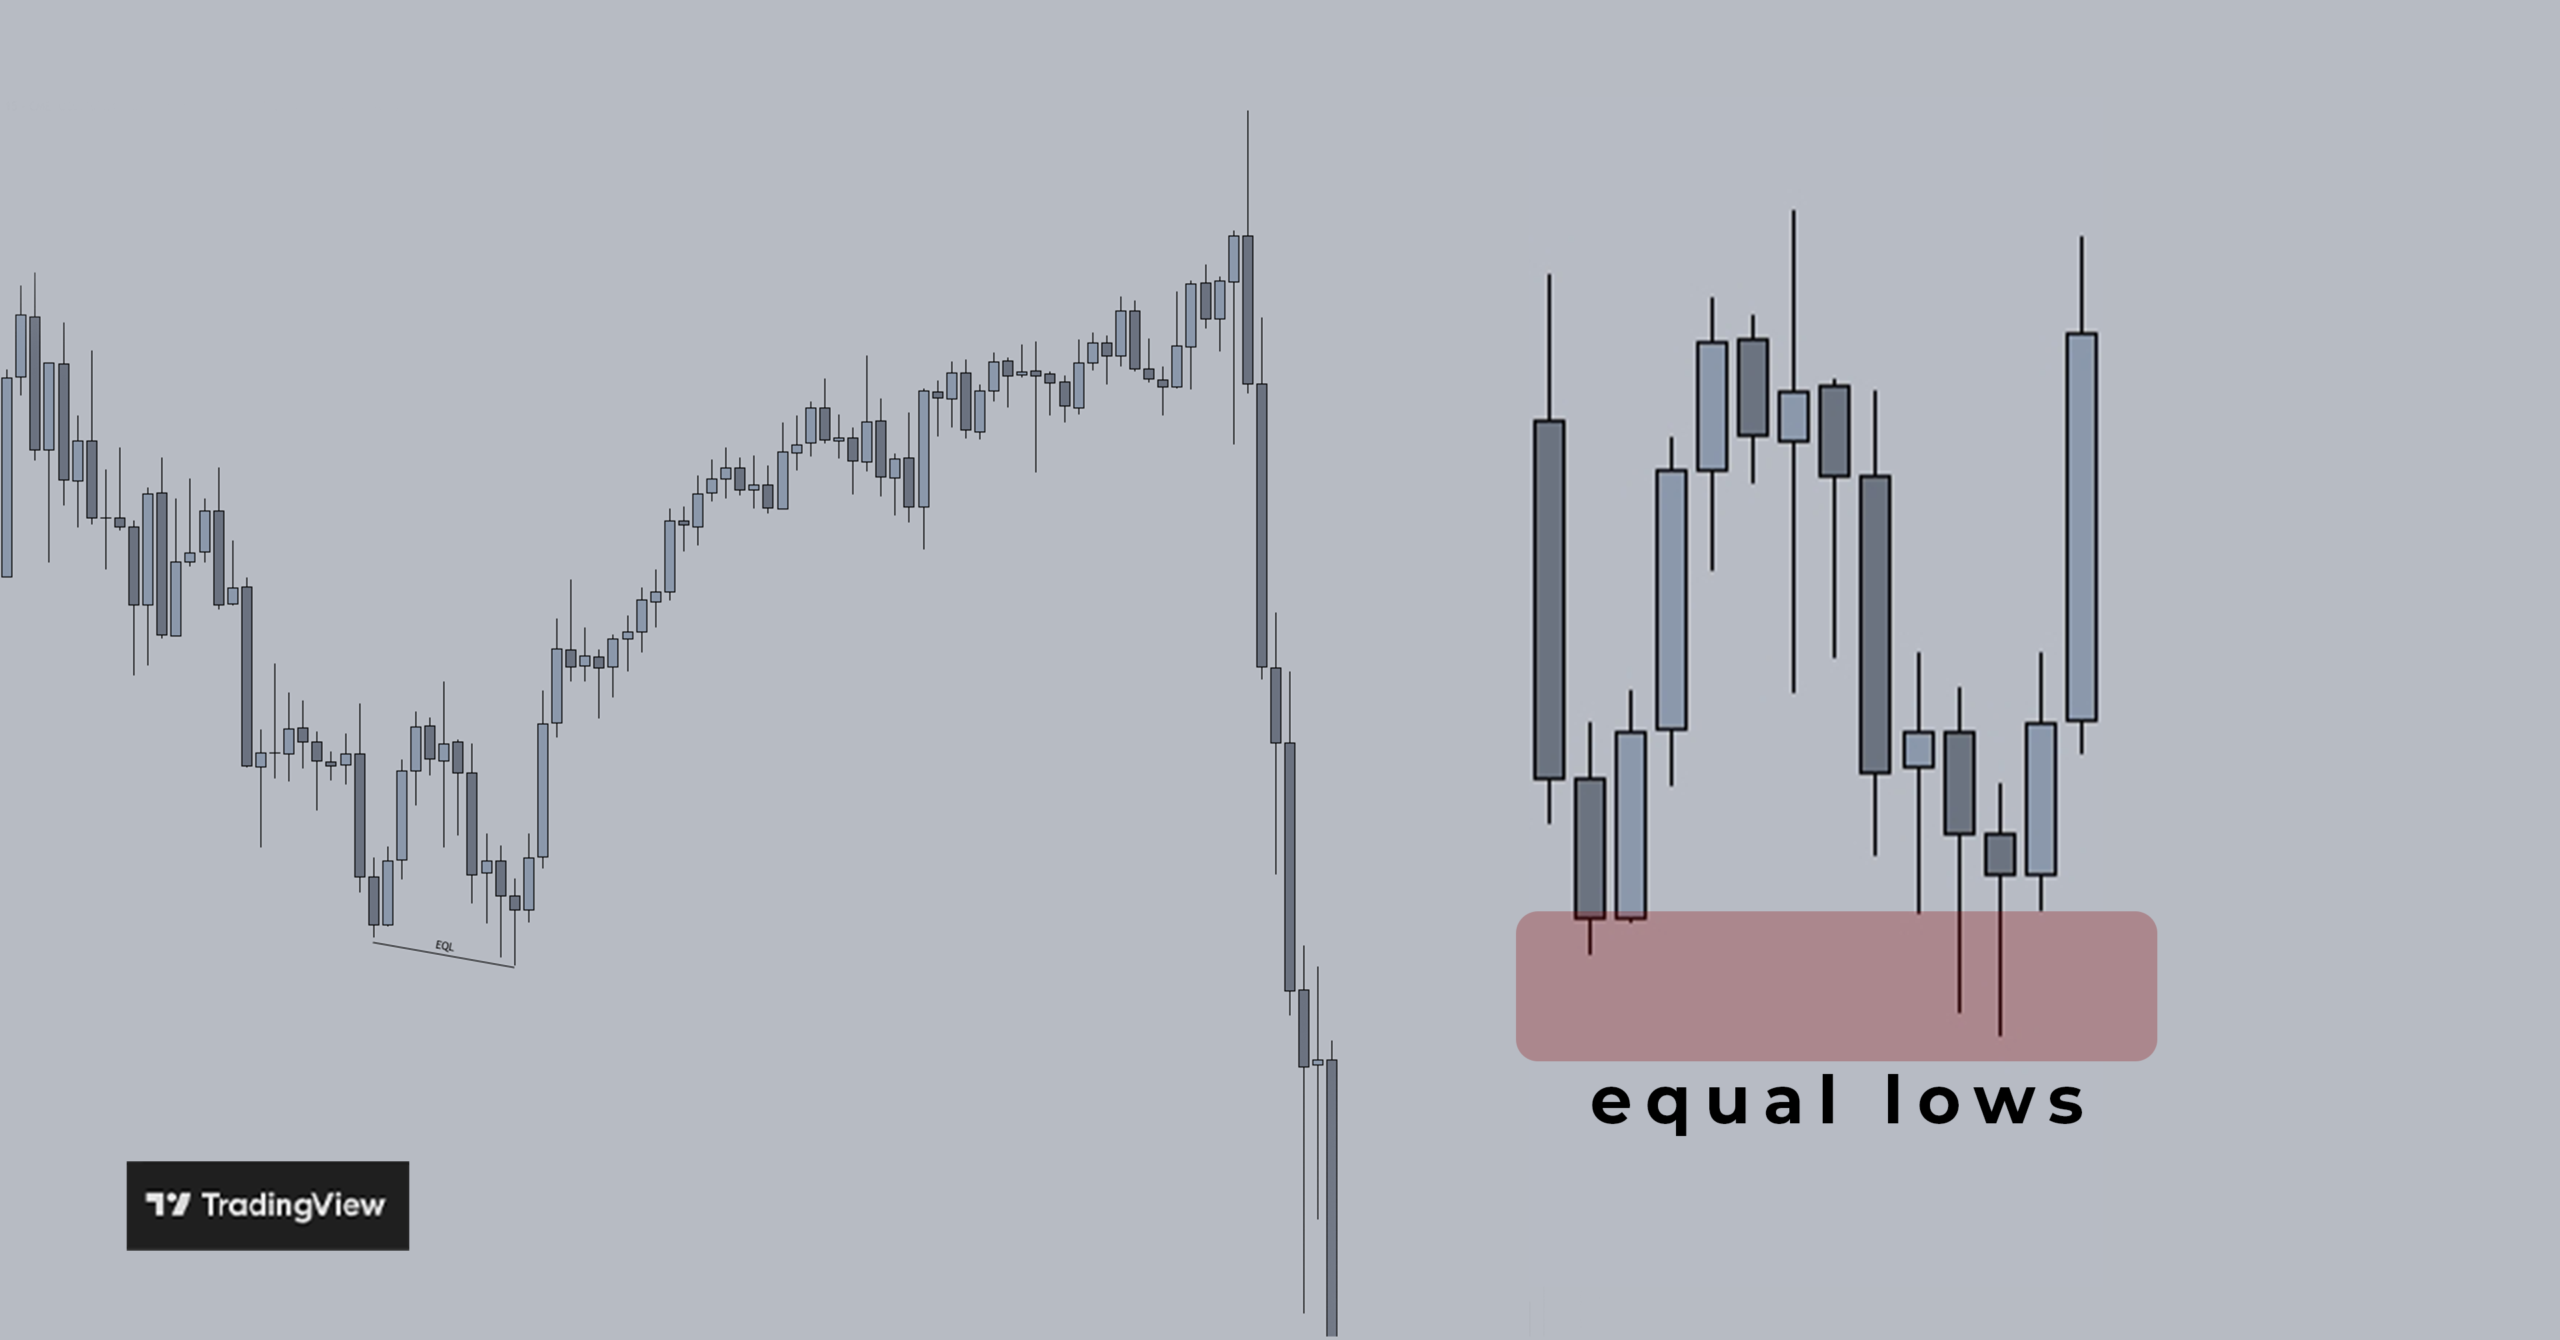
charts by TradingView
equal lows can be a point of interest from which a long setup might form or be used as targets.
EQ: equilibrium
Equilibrium is the midpoint of a price range.
In a downtrend, price will oftentimes retrace back up to equilibrium before continuing its move lower.
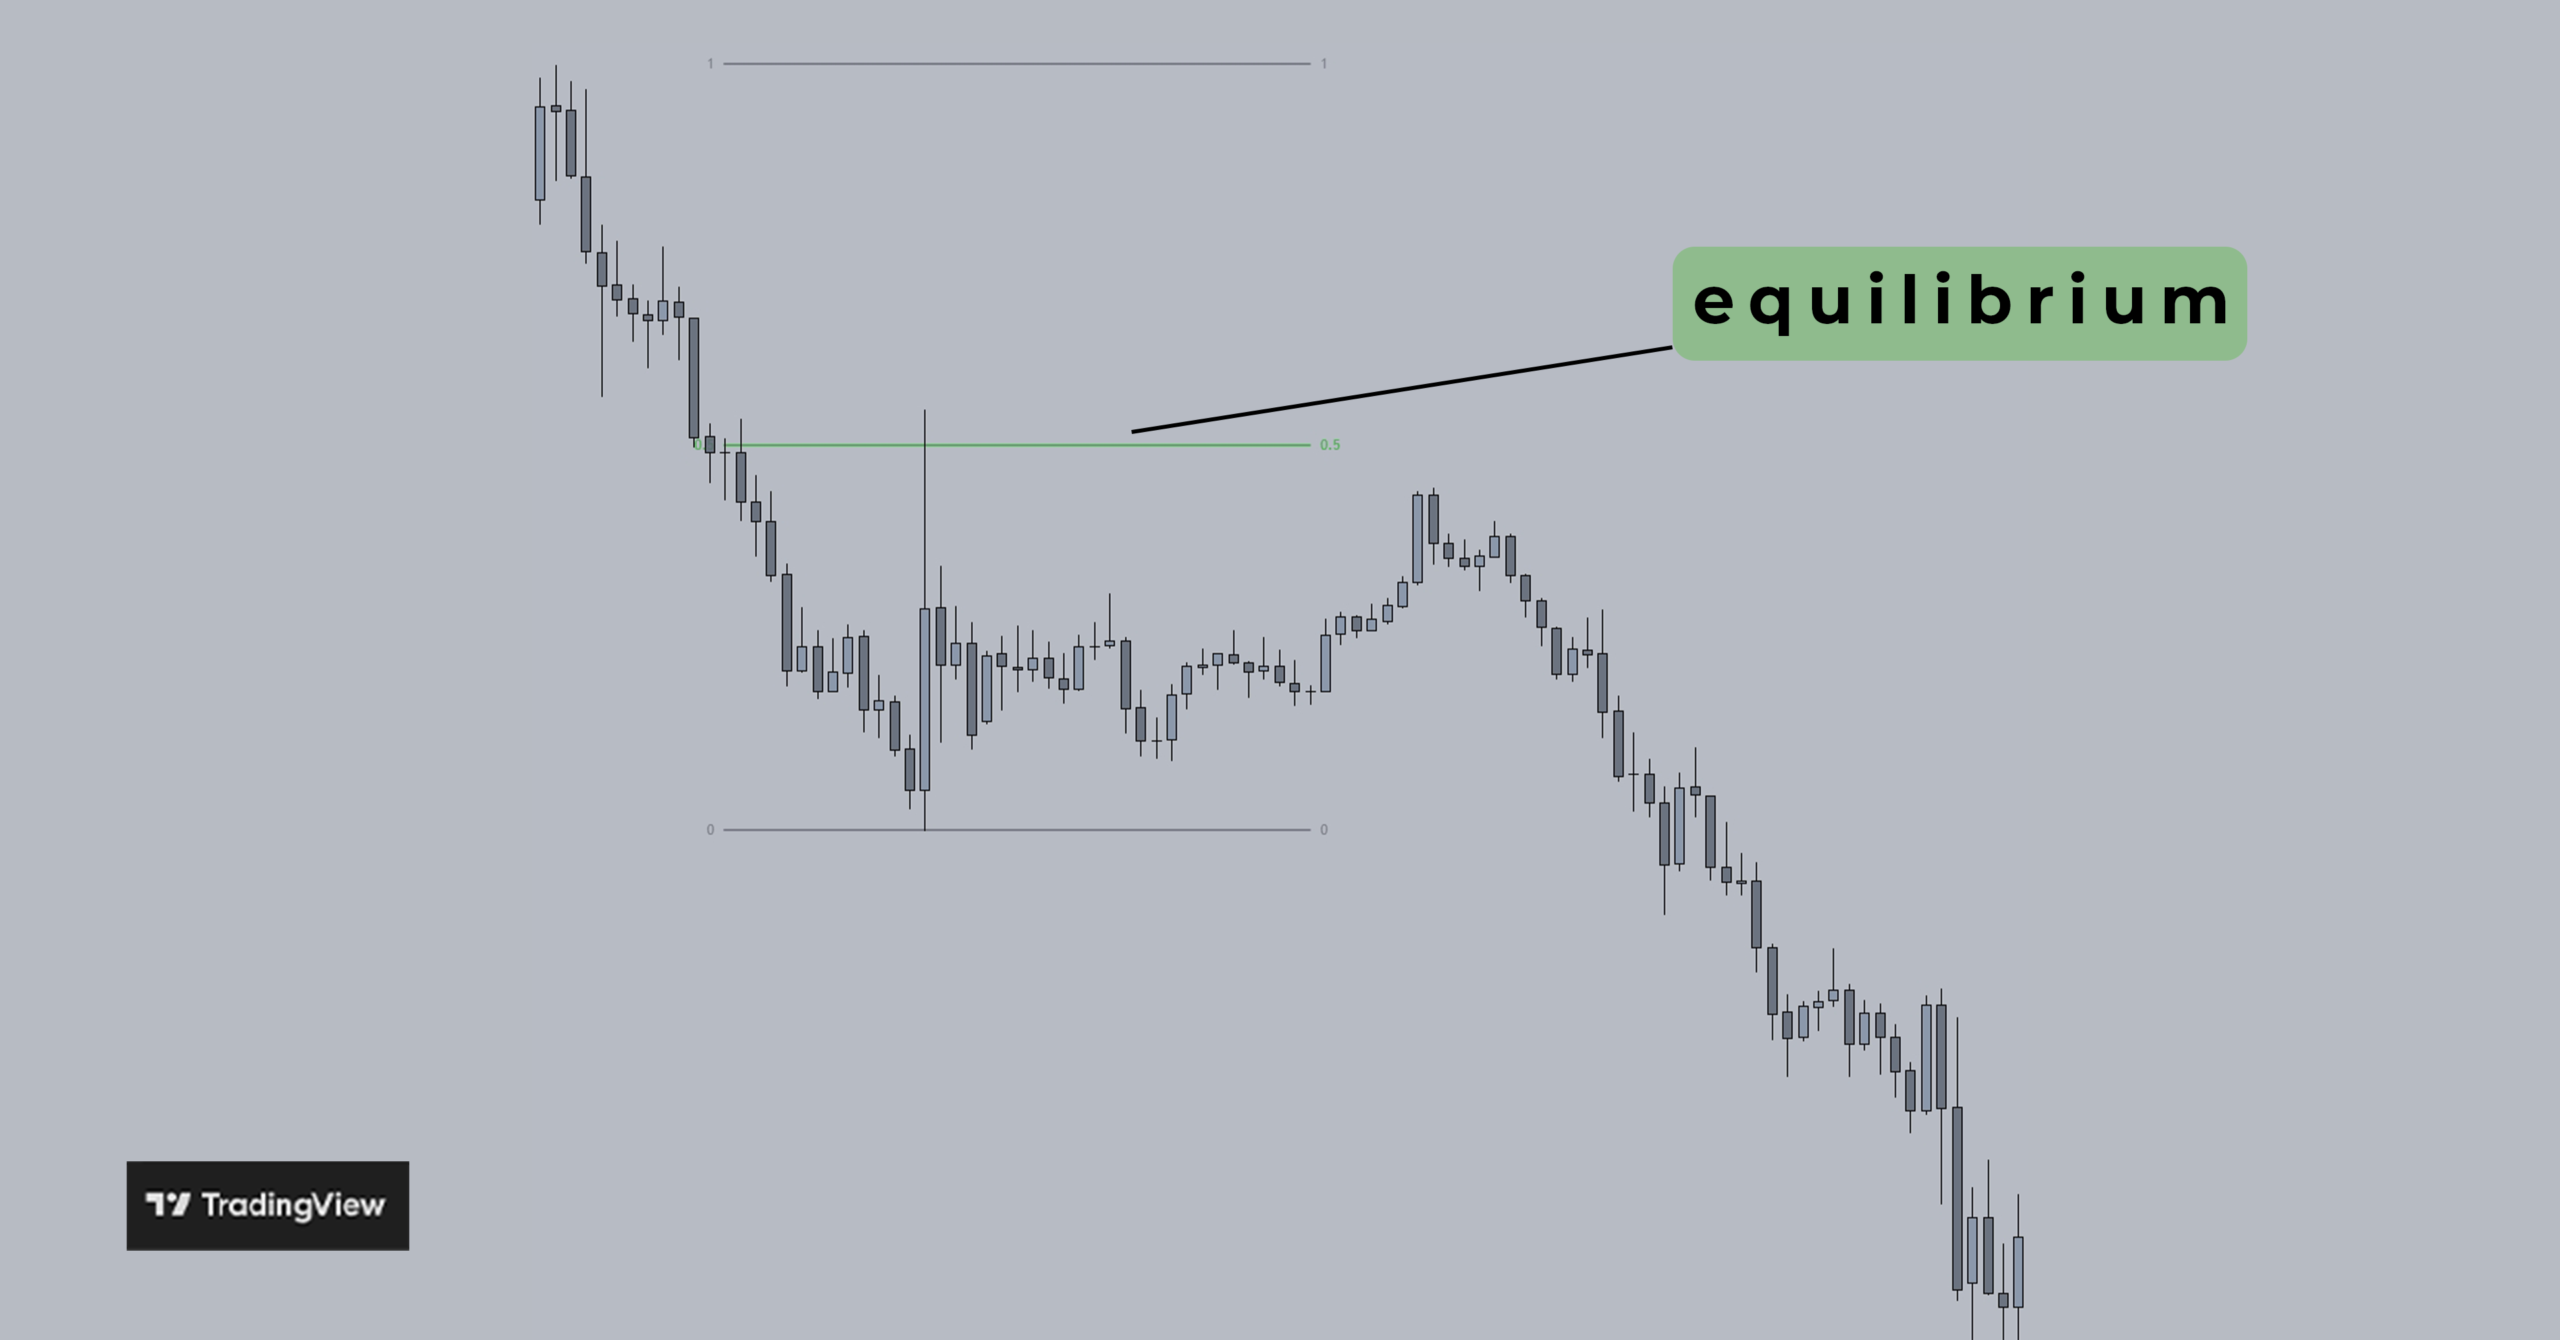
charts by TradingView
In an uptrend, price will oftentimes retrace down to equilibrium before continuing its move up.
Use the Gann box tool to draw from swing low to swing high of a price range to find EQ of a range (0.5 level)
Equilibrium can be used to find high quality entry points if paired with a liquidity sweep or a fair value gap around that level and to figure out in which direction the market is moving.
LRL: low resistance liquidity
Low resistance liquidity refers to a series of un-swept highs or lows. Those act like a magnet for rapid, aggressive price movements with minimal to no retracement.
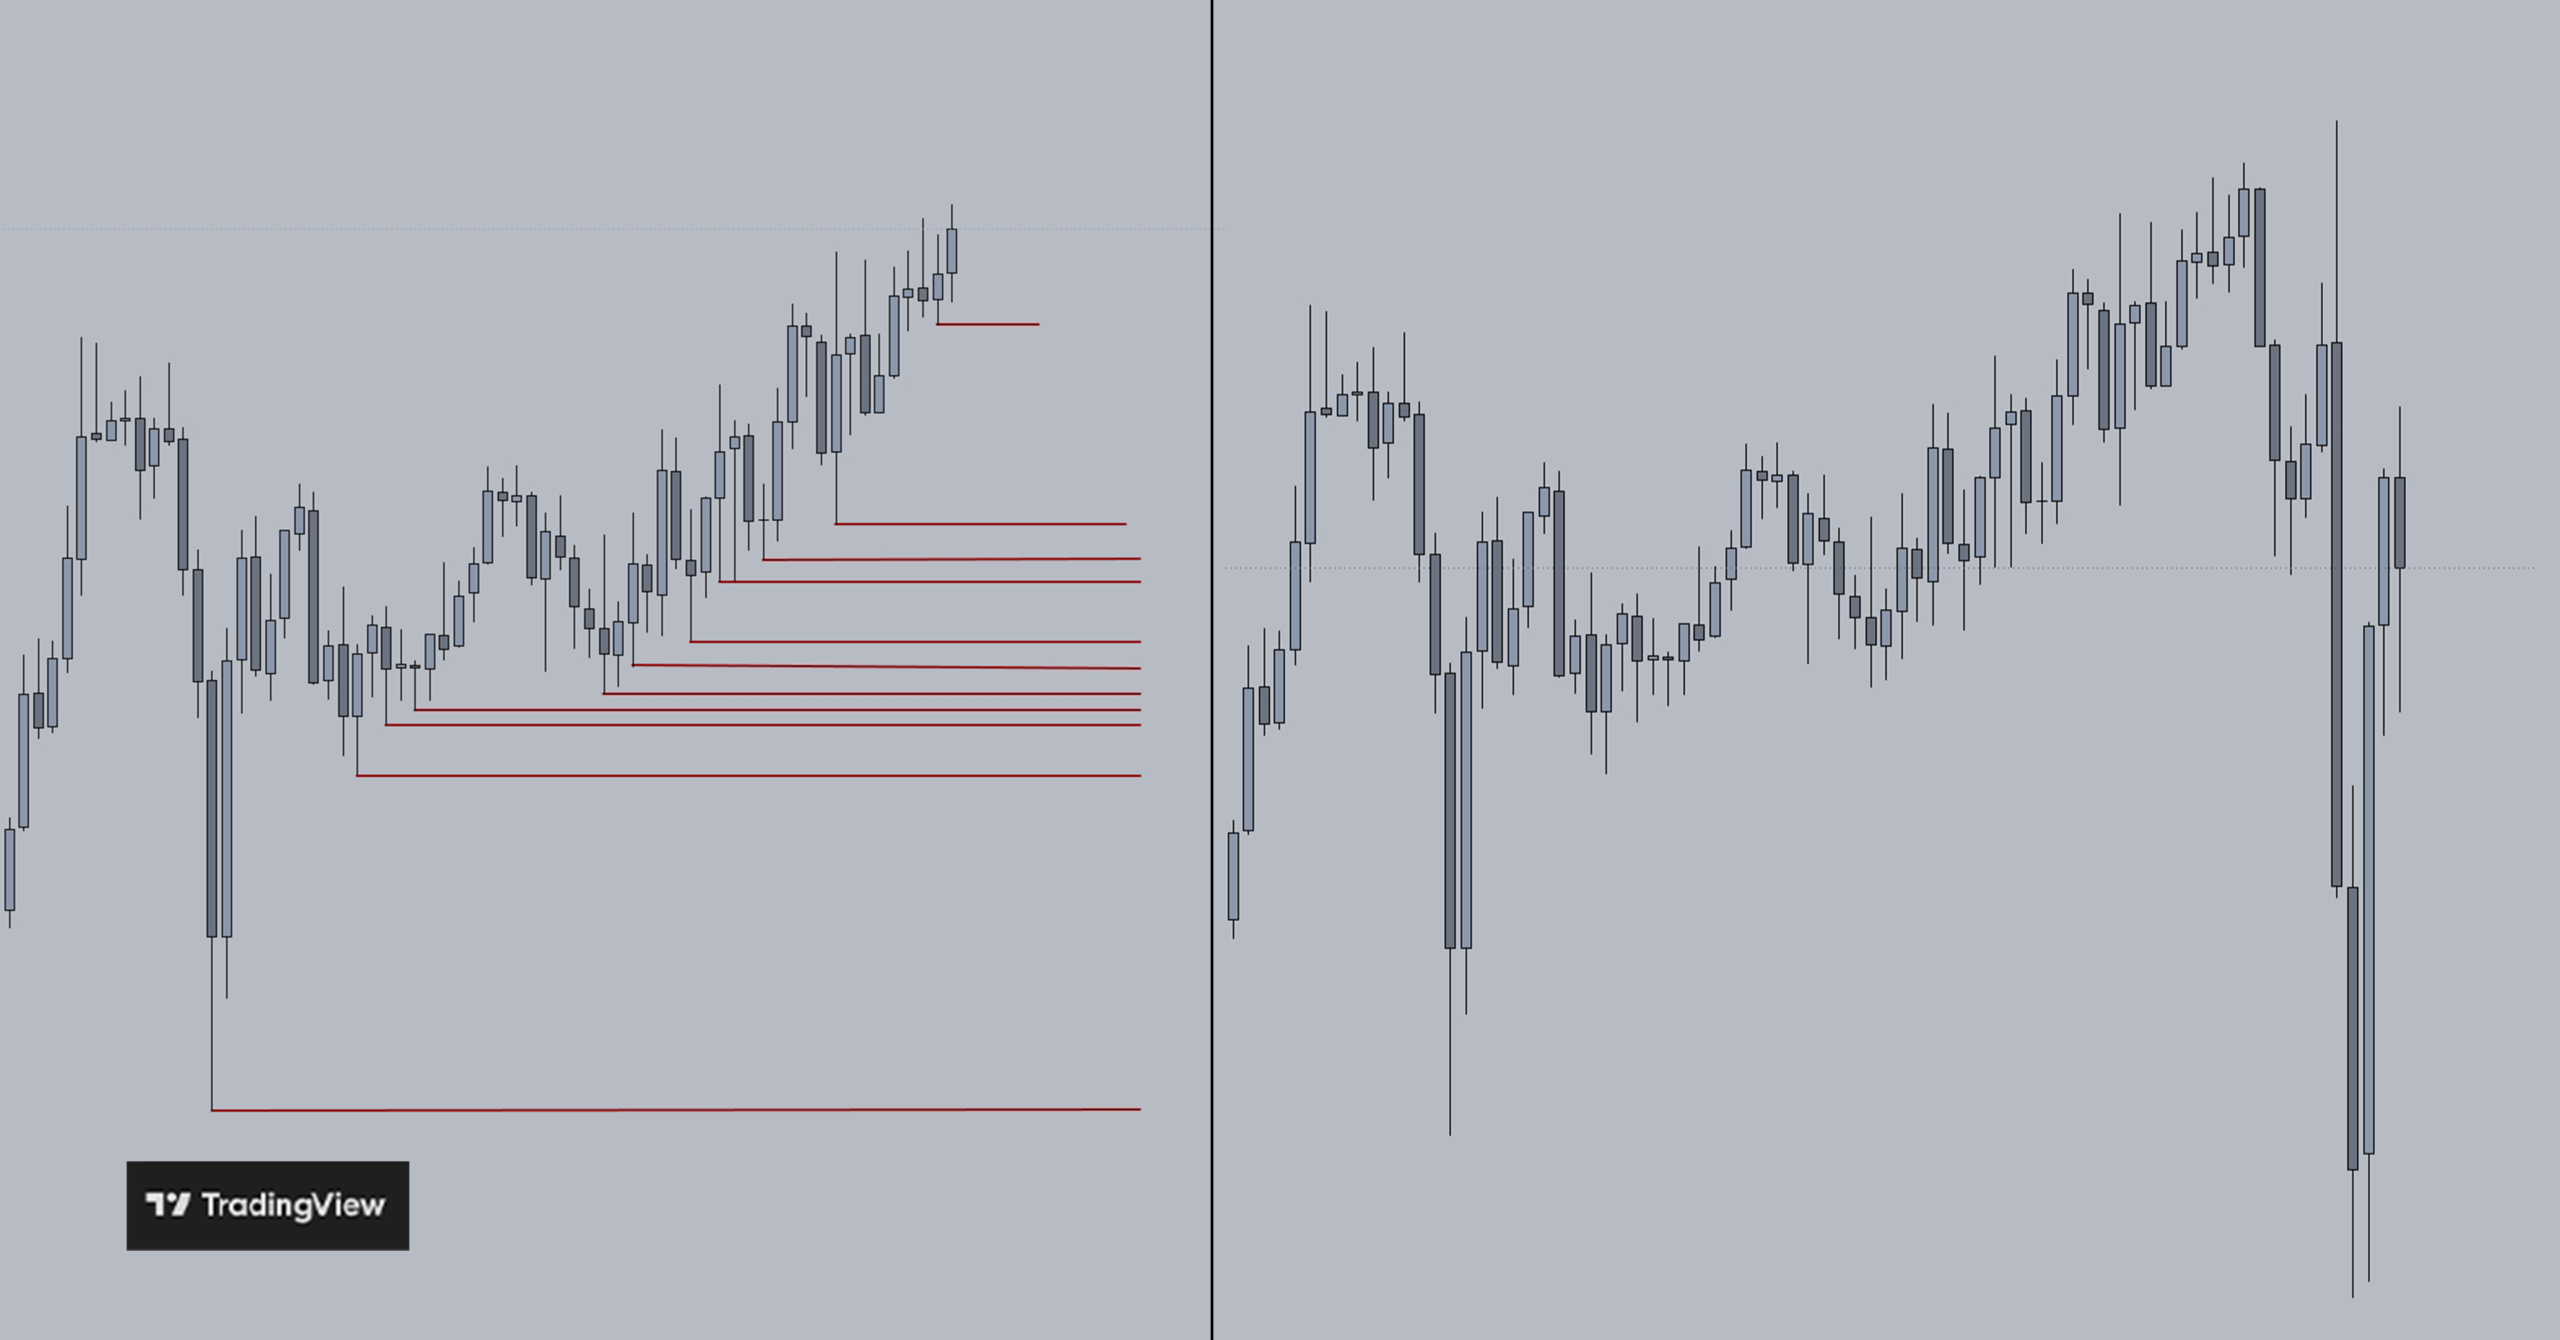
charts by TradingView
Low resistance liquidity can help you figure out in which direction price wants to go.
It can also be used as a target or as a point of interest from which a setup might form after a sweeping the LRL gets swept.
This article is for informational purposes only and does not constitute financial advice.