

The Bitcoin Cycle
There is very interesting pattern in timing when it comes to Bitcoin all time highs and the bottoms of a bear Market.
| Cycle | ATH → Bottom | Bottom → ATH | Total |
|---|---|---|---|
| 2017–2021 | 364 days | 1,064 days | 1,428 days |
| 2021–2025 | 378 days | 1,050 days | 1,428 days |
The total cycle length for both cycles is identical: 1,248 days. ~1 year down, ~3 years up.
If you average the the two bear markets:
(364+378)/2 = 371 days
and the two bull markets:
(1,064+1,050)/2 = 1,057 days
Those averages also sum up to 1,428
This indicates that the cycle appears to preserve it’s total duration while shifting time from the bull phase to the bear phase.
The 2021-2025 cycle had a 14 days longer bear phase and 14 day shorter bull phase than the 2017-2021 cycle.
Notice how the shifts perfectly cancel each other out – instead of a random +22 day bear market and a -11 bull market it was a +14 day bear and -14 day bull market. An exact offset.
The cycle splits into roughly 25% bear market and 75% bull market.
2017 – 2021 cycle:
364/1,428 = 25.5% (bear market)
1,064/1,428 = 74.5% (bull market)
2021-2025 cycle:
378/1,428 = 26.5% (bear market)
1050/1,428 = 73.5% ( bull market)
Despite different macro environments, both cycles were completed in 1428 days, implying that timing carries more weight than fundamentals.
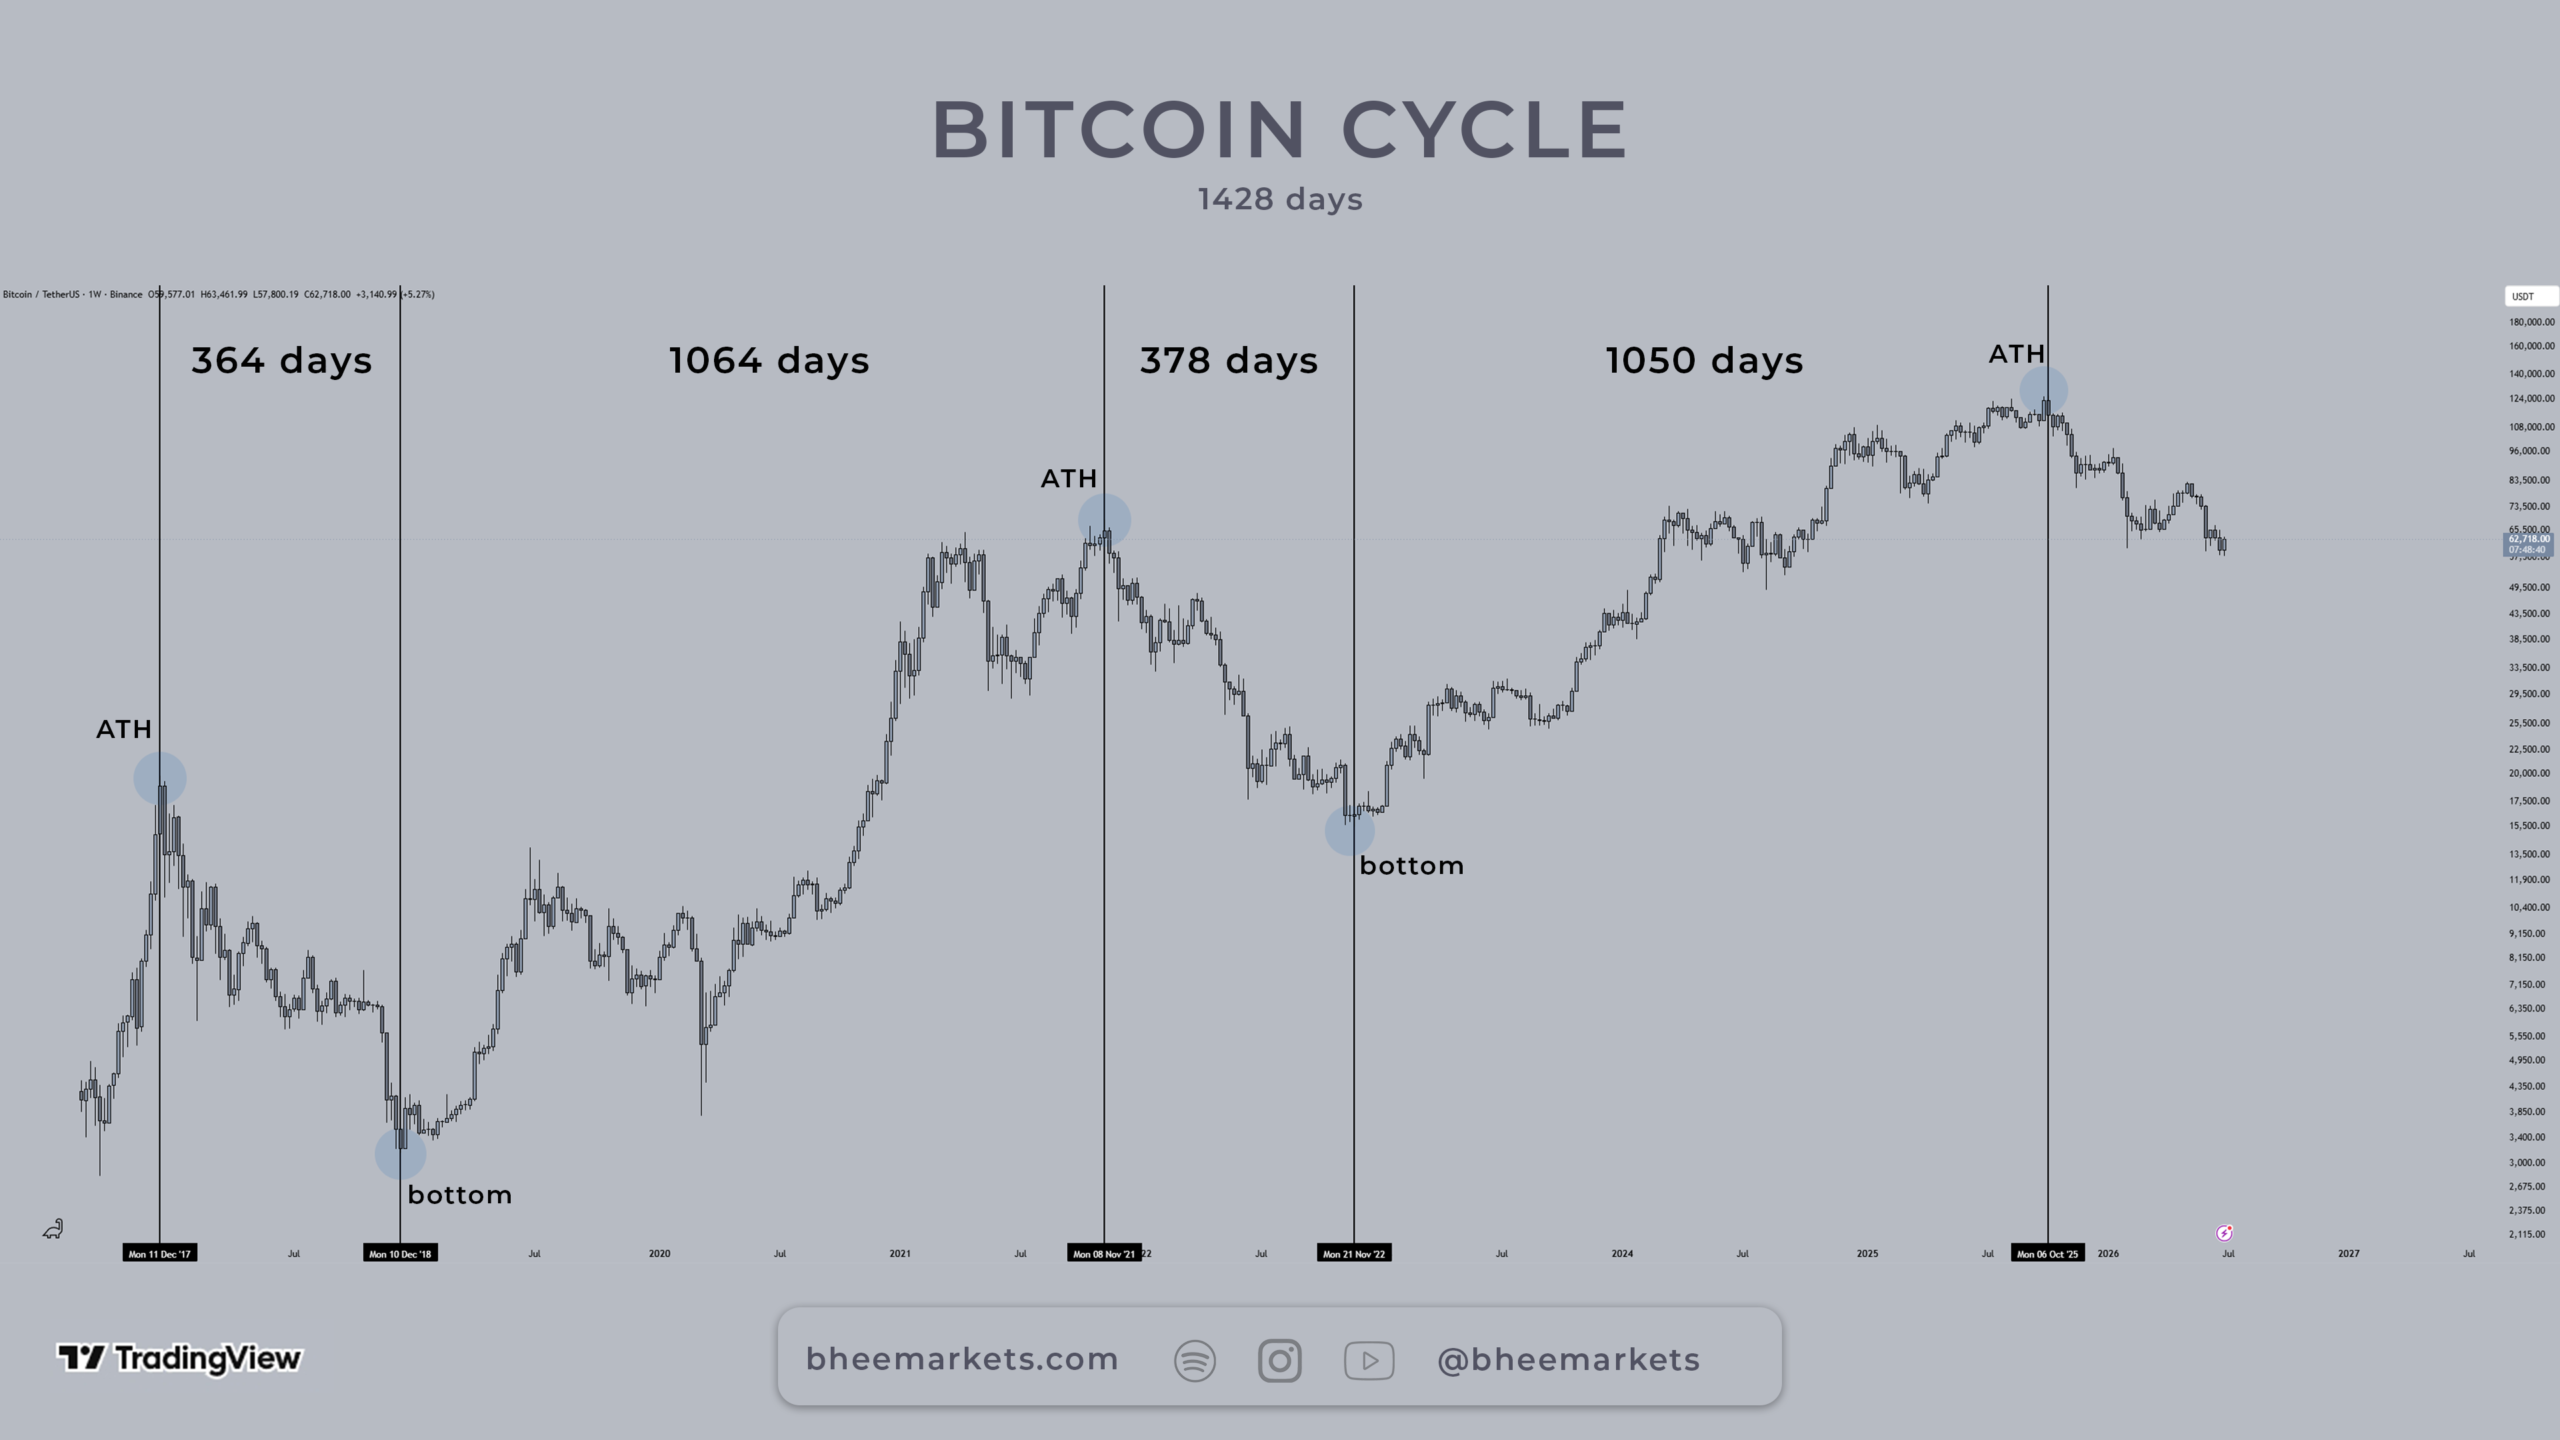
chart by TradingView
Bitcoin Halving and All Time Highs
There is another interesting timing relationship between the Bitcoin halving and the ATH created after it:
Halving → ATH
| Cycle: Halving → ATH | Days |
|---|---|
| Jul 9, 2016 → Dec 11, 2017 | 520 |
| May 11, 2020 → Nov 8, 2021 | 546 |
| Apr 20, 2024 → Oct 6, 2025 | 534 |
The average run to ATH after the halving is around 533 days.
Estimating All Time Highs And Bottoms
Obviously, this data doesn’t make it possible to time the exact ATH and bottom, but it might be possible to estimate a time window in which a bottom and all time high might form. That is if the pattern continues to repeat. I only presented 2 cycles as Data. The more cycles follow this pattern the higher the probability of it repeating again. Although there is no guarantee.
If we assume this timing pattern to continue, Bitcoin could put the next bottom in sometime in October 2026:
Recent ATH October 6, 2025, then (Using the average days of the previous bear markets):
- 364 days → October 5, 2026
- 371 days (average) → October 12, 2026
- 378 days → October 19, 2026
If you would have calculated the next ATH time window after the 2024 halving using the average days from the prior halving’s, you would have gotten a shocking almost perfect result:
April 20, 2024 (halving) + 533 days (average days from halving to ATH) = October 5th 2025
The 2025 ATH was printed on October 6th 2025. That’s just a one day difference.
Quarters and the Moon
Another things that immediately stands out is that ATH’s and bottoms are formed in Q4 (up until now) and that both bottoms were very close to a new moon ( the new moon might be a coincidence, but if this repeats it might help to narrow down the estimated time window a bit more.)
This article is for informational purposes only and does not constitute financial advice.